This site uses cookies to improve your experience. To help us insure we adhere to various privacy regulations, please select your country/region of residence. If you do not select a country, we will assume you are from the United States. Select your Cookie Settings or view our Privacy Policy and Terms of Use.
Cookie Settings
Cookies and similar technologies are used on this website for proper function of the website, for tracking performance analytics and for marketing purposes. We and some of our third-party providers may use cookie data for various purposes. Please review the cookie settings below and choose your preference.
Used for the proper function of the website
Used for monitoring website traffic and interactions
Cookie Settings
Cookies and similar technologies are used on this website for proper function of the website, for tracking performance analytics and for marketing purposes. We and some of our third-party providers may use cookie data for various purposes. Please review the cookie settings below and choose your preference.
Strictly Necessary: Used for the proper function of the website
Performance/Analytics: Used for monitoring website traffic and interactions
In today’s architectures and functional metrics, value optimization does not exist. And, when procurement and tactical planning operate in isolation, there is no decision support framework to guide the trade-offs especially when the functions are tethered to different and conflicting metrics. You are right.
When I started this research project, I was busy. One of my lessons learned in completing survey-based research over the past twelve years, is that projects are full of surprises. In my post Mea Culpa, I reference my work with the Gartner Supply Chain Hierarchy of Metrics. Error is error, but is it the most important metric?
According to research by Ernst & Young LLP, the global consulting firm, as the Covid crisis recedes, supply chain executives are losing the strategic gains they made with their C-suite counterparts. The EY research suggests that at many companies, that opportunity is receding. What gets measured affects what gets prioritized.
The DOE is still issuing large federal loans to startup companies, Novonix a synthetic graphite startup just received a $755 million loan to support its mission and reach its goal of producing 31,500 metric tonnes of synthetic graphite.
Just by embedding analytics, application owners can charge 24% more for their product. How much value could you add? This framework explains how application enhancements can extend your product offerings. Brought to you by Logi Analytics.
On December 5th, Supply Chain Insights is hosting a small event at Georgia Tech to share the results of a two-year research effort to connect financial metrics by industry to supply chain performance to drive value. Did you know that improvement in the supply chain drives 50-70% of this value metric?
Now the writing follows the research. I mix the quantitative research with my observations and interviews, and the posts seem to roll from my fingers. If you would like to participate in a current research study, we would love your help and participation in the contract manufacturing study. (If It was a struggle!) Figure 3.
During my current supply chain planning market research, I have received briefings from several SCP companies. Solvoyo has a metric they call the user acceptance rate. All are investing in artificial intelligence. Autonomous planning is a type of planning that takes humans out of the planning loop.
Functional Metrics and the Lack of Alignment to Strategy. Few companies are clear on the number of supply chains they operate, design the rhythms and cycles of each, and align metrics to the strategy. In our research, small regional companies outperform large multinationals. The industry is not clear on desired outcomes.
The research methodology for the Supply Chains to Admire compares the performance of a company against its industry peer group for the metrics of Year-over-Year Revenue Growth, Inventory Turns, Operating Margin, and Return on Capital Employed (ROCE). Today, companies measure too many metrics without a clear definition of value.
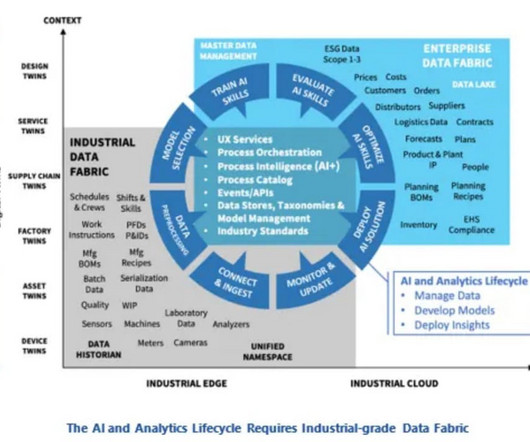
According to Colin Masson, a director of research at ARC Advisory Group, the opportunity to mine these vast quantities of data to achieve business value is “NOW.” Mr. Masson leads ARC’s research on industrial AI and data fabrics. Not all the transactional data, just the data required to calculate a metric or make a decision.
Investment in research and partnerships is crucial for scaling these solutions industry-wide. Research and development are needed to overcome these limitations and ensure affordability. Set Measurable Goals: Establish clear targets for emissions reduction, energy efficiency, and sustainability metrics.
According to my research, top-performing supply chains possess three very different qualities. To help the reader, let’s start with definitions used in our research: Efficiency. In Table 1, from our research, I share ten tactics to consider. Reward teams for cross-functional metrics. Customer-Centric Supply Chain.
In this area of research, I find that companies are like dogs chasing cars. At each company, there is a relationship between the metrics of growth, margin, inventory, customer service, and asset strategy. For the purpose of this article, I will use Return on Invested Capital (ROIC) as the proxy metric to discuss asset utilization.)
Conduct Comprehensive Financial Analysis Demonstrate tangible ROI by highlighting: Projected revenue improvements Cost savings Return on investment metrics Performance during market volatility Real-world data shows probabilistic forecasting can improve forecast accuracy by 15-25% compared to traditional methods.
Despite goals to improve agility and resiliency, functional metrics for manufacturing efficiency continually throw the supply chain out of balance. However, in my research, I find four factors make the difference (correlations at an 80% confidence level): Supply Chain Leadership. The second step is to align metrics to the strategy.
I share research, observations, and insights. How aligned do you believe your organization is to drive these metrics? I shared this after interviewing 150 companies on their S&OP processes while at AMR Research. This research, completed in 2006, was during the transformation of multi-national to global supply chains.
Using balance sheet data from 2011 to 2019, we chart companies’ progress by peer group on rate of improvement and performance in the metrics of growth, operating margin, inventory turns, and Return on Invested Capital (ROIC). A focus on functional metrics throws the supply chain out of balance.) We Give to You.
In our recent report on defining supply chain visibility in B2B networks, we provide a definition based on a research study of over seventy participants. The more research that I do the more convinced that I am that we have not powered our networks for success. They don’t. The term supply chain visibility varies by role.
For five of the past ten years, I voted on the Top 25 when I was an analyst at AMR Research (before the acquisition of AMR Research by Gartner). As a result, the metrics have to be viewed together as a pattern over time. In the journey, the supply chain leader needs to improve the potential of a portfolio of metrics.
Tracking the Metrics that Matter. While Ardent expects Procurement to rise to and tackle these challenges, tracking the metrics that matter will help them stay focused for full recovery. Inflation Metrics. Tracking this metric and taking steps to improve it can help combat inflation. Risk Metrics.
The results in table 1 come from a nine months research project of 120 respondents representing 183 instances of demand and supply planning. What can we learn from this table, and the research? The second thing that I learned from the research is that we do not have good solutions for large organizations in the market today.
In my research, I find that the lack of alignment has a direct impact to value (operating margin and market price to book value). Functional Metrics. This maniacal focus on improving functional metrics threw the supply chain out of balance and made the organization less able to work together to solve issues.
Supply Chain Improvement is based on the work that we completed with an Arizona State University Operations Research team to determine the Supply Chain Index. Attending the conference was Alexia Howard, Senior Research Analyst – US Foods for Sanford C. Aligned Metrics. We find that this is true of too few companies.
As an analyst in the market for the past ten years (first with Gartner, then with AMR Research, followed by my work at Altimeter Group and now with my own firm Supply Chain Insights), I have stood in front of clients doing strategy days advocating “best practices” and I wanted to set the record straight. We have stubbed our toes.
In the research, I’m trying to understand the impact of choices—technology, process innovation, and leadership– on balance sheet performance. The research is independent and data-driven. For the past six years, I have analyzed public reporting and triangulated the results to the quantitative research. What have I found?
So much so, that three years ago, I founded a research company to focus on understanding supply chain excellence. In our work, we tie research from quantitative and qualitative studies to financial results to drive new insights. When all functions are jointly focused on improving these metrics, then we can have one team.
Jonathon and Sarah are partners in PATH , a supply chain market research and business management firm that helps businesses understand their customers, employees, and the market better to drive long-term growth. Employee engagement, market research, strategic planning, and more.
And the linked nature of supply chains mean that collaboration is necessary to ensure that a solution to a problem doesn’t meet the metrics for one link but negatively impact another. Latency kills agility, because by the time the spreadsheet you need lands in your inbox the situation has likely already changed.
Based on our recent research, we find that only 1% of process-based companies are making progress on both operating margins and inventory. Which supply chain metrics correlate to market capitalization by Morningstar sector? Numbers don’t lie. Companies are stuck. As a result, I don’t believe that we have best practices.
As I search for answers, three questions are top of mind in my current research. One of my stark realizations this year is that smaller companies are beating larger and often more established companies on growth metrics, inventory turns, operating margin, and Return on Invested Capital (ROIC). (In Look for the full report next week.).
It is the end of a two-year research project, and identifies which publicly held companies outperformed their peer group on balance sheet results. Here we share the answers to the questions that we get the most often about this research: What is the source of data? Today we published a new report, Supply Chains to Admire.
If the arrow is red, the industry is moving backwards on a metric. While we agree that each of these companies are leaders with significant contributions to the industry, we do not find these companies outperforming when compared against their peer groups on a balanced portfolio of metrics. This is part of our future research.
Price index and price elasticity are useful metrics on their own, and a combination of these can help determine the right price point to maximize revenue and profit. Since there are often differences in store sizes, a metric representing the size can be added as well for a two-dimensional clustering approach. Asena holds B.S.
I now have a working manuscript for the entire book of Metrics That Matter. In preparation, we are finishing up research on supply chain planning excellence, big data and supply chain, supply chain talent, and digital manufacturing. As always, we would love your insights on our research studies. It has been a good week.
Some of the packages on the trucks moving right now are the first shipments of Metrics that Matter. The book is the end of three years of research and nine months of writing. So, if your doorbell rings, with your copy of Metrics that Matter, think about the importance of logistics this holiday season. What do you think?
It’s important to remember that when you document your needs, do your market research and run a proper evaluation process, youre not just finding a service provider – youre finding a partner who can help evolve your business. You also need to ensure that you’re cascading these metrics through your organisation.
Note to the reader: we selected these metrics for the balanced scorecard for the analysis after work with Arizona State University to understand which metrics, in combination, most closely correlated with market capitalization. Consider the role of functional metrics and the lack of alignment with the corporate scorecard.)
The research that I have conducted has enabled me to look at this holistically. When I left AMR Research I invested over 400K in building a database of supply chain financial ratios to correlate supply chain results. After three years of research, I have just refined the methodology to start to pull the trends. I am an old gal.
It is now our fifth year of analyzing balance sheets to understand which companies are outperforming their peer groups on the metrics of growth, operating margin, inventory turns and Return on Invested Capital (ROIC) while driving improvement. It takes us three months and two full-time research assistants to finish the analysis.
We analyzed the impact of 150 factors on 493 financial metrics for the period of 2004-2016. This research was tough work. By graphing the financial metrics through orbit charts, we find that 90% of companies are stuck at the intersection of operating margin and inventory turns. It took us four months. The results?
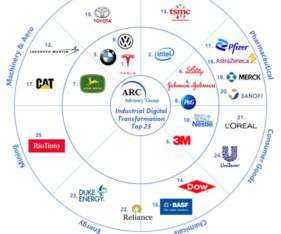
D’Aquila is a director of research at ARC. This orientation is fundamental in determining what KPIs the company values, as many of them are far different from metrics managed by manufacturers relying on traditional views of success.”. Tesla scored the top spot, followed by Intel, BMW, Johnson & Johnson, 3M, and Eli Lilly.
In the research, we find that deploying an outside-in model always beats an inside-out model, reducing process and data latency while improving the organization’s ability to make decisions at the speed of business. Lack of aligned metrics. As boomers retire and planners change jobs, we are not retaining planning basics.
We speak about the need to move from a functional understanding to a global, holistic capabilities, but the traditional supply chain leader defines bonus incentives and process performance goals based on functional metrics. In 2004, my research showed a bell curve of innovators and laggards. Measurement. Innovation.
We organize all of the trending information in your field so you don't have to. Join 102,000+ users and stay up to date on the latest articles your peers are reading.
You know about us, now we want to get to know you!
Let's personalize your content
Let's get even more personalized
We recognize your account from another site in our network, please click 'Send Email' below to continue with verifying your account and setting a password.


Let's personalize your content