This site uses cookies to improve your experience. To help us insure we adhere to various privacy regulations, please select your country/region of residence. If you do not select a country, we will assume you are from the United States. Select your Cookie Settings or view our Privacy Policy and Terms of Use.
Cookie Settings
Cookies and similar technologies are used on this website for proper function of the website, for tracking performance analytics and for marketing purposes. We and some of our third-party providers may use cookie data for various purposes. Please review the cookie settings below and choose your preference.
Used for the proper function of the website
Used for monitoring website traffic and interactions
Cookie Settings
Cookies and similar technologies are used on this website for proper function of the website, for tracking performance analytics and for marketing purposes. We and some of our third-party providers may use cookie data for various purposes. Please review the cookie settings below and choose your preference.
Strictly Necessary: Used for the proper function of the website
Performance/Analytics: Used for monitoring website traffic and interactions
The future inventory fire sale. One of my stark realizations this year is that smaller companies are beating larger and often more established companies on growth metrics, inventory turns, operating margin, and Return on Invested Capital (ROIC). (In The metrics selection resulted from work with Arizona State University in 2013.)
Because we call it a supply chain for a reason – each link is connected, so if you rattle one link, you rattle the entire chain, as Boeing famously discovered in 2007 when a bolts and screws shortage delayed their Dreamliner. But the opposite is not true – if you optimize one link, you have not optimized the entire supply chain.
Inventory, in this time of uncertainty, is the organization’s most important buffer to protect against variability. However, organizations are not good at managing inventory. Cash-to-Cash Metrics. Cash-to-cash is a compound metric: (Days of Receivables+Days of Inventory)-Days of Payables=Cash Conversion Cycle.
I am speaking this morning at the Terra Technology conference and doing a book signing of my new book, Supply Chain Metrics That Matter. In parallel, I have been hard at work on a report on multi-tier inventory optimization for the last two weeks. It is morning in Orlando. The sun is rising. This inbound news adds to the story.
When it comes to the management of inventory in value chains, frustration abounds. Executive, after executive, lament, “They have purchased many technologies and sponsored many projects to reduce inventories, but they are not seeing results.” Inventory is the culmination of many business decisions. Tracking Progress.
If the definition is the balancing of costs and inventory, the winner is Colgate. However, what is now clear to me is that whatever the evaluative metric, Unilever is at the bottom of the CPG peer group and should never be seen as a supply chain leader. The goal of Colgate was to get regional input, but manage a global brand presence.
Companies tightly coupling the budget to S&OP have significantly higher inventories and lower growth than their peer group. Deployment of deeper statistical engines for inventory management with a focus on safety stock will improve inventory levels. Industries carried on average 32 days more inventory in 2020 than in 2007.
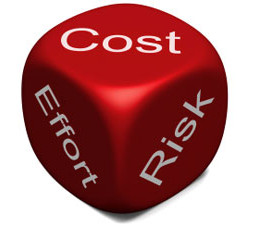
Granular data by volume is a must to be able to manage replenishment, network design, and inventory targets. A simplistic view is that supply chain excellence is the trade-off of cost, inventory and customer service. To maximize value—price to tangible book, functional metrics need to be reset to focus on reliability.
The supply chain is a complex system with finite, and non-linear relationships between supply chain metrics that drive balance sheet results. In our analysis, only one out of ten companies successfully improves operating margins and inventory turns at the same time. We find that companies can improve one, but not two of the metrics.
Over the period of 2009-2015, only 88% of companies made improvement on the Supply Chain Metrics That Matter. To meet the criteria for The Supply Chains to Admire for 2016, companies needed to score better than their peer group average for performance metrics, while driving a higher level of improvement than 2/3 of their industry peer group.
The winners drive improvement while posting financial results in the Supply Chain Metrics That Matter ahead of the peer group. Inventory Turns. Better performance in inventory turns than the peer group average for the period of 2006-2015. Orbit Chart of Colgate at the Intersection of Operating Margin and Inventory Turns.
A Demand-Driven Value Network as defined by AMR Research in 2007: A network that senses demand with minimal latency to drive a near real-time response to shape and translate demand. The focus is on channel data: price; inventory positions; and policies. We then began the discussion on outside-in processes. Market-Driven Processes.
I first met Shane in 2007 at the beginning of his work with Syngenta’s value chain. Orbit Chart Comparing Syngenta and Monsanto Progress on the Effective Frontier – Balancing Inventory Turns and Operating Margin for the Period of 2005-2014. He led the team during the period of 2007-2009. Shane’s Story.
This boosts revenues and optimises inventory. This can be applied to inventory management, fleet and order tracking, ID badging. Amazon’s supply chain heavily depends on the outsourcing of its inventory management. Pricing decisions can be integrated with demand and supply planning. In a crisis economic factors are critical.
Blog Expert Advice 8 min read 12 Jun 2023 By Taulia Share: Share via linkedin Share via twitter Share via facebook Share via email Copied Copy page URL to clipboard 10 supply chain KPIs and metrics to track We’ve listed the 10 top supply chain KPIs you can use to measure your supply chain performance and find opportunities for optimization.
Using so called orbit charts, we have benchmarked companies on EBIT% versus Inventory Turns. That benchmark helped to reveal the ‘best practice frontier’, which in turn helped in setting aggressive but aligned targets for EBIT% versus Inventory Turns. Benchmarking EBITDA% versus Inventory Turns. It proves to be more resilient.
I am bolder on Samsung, simply because they had the highest 2016 Inventory Turns aside from McDonalds. The new trend to be sustainable is part of the current category: Revenue Growth, so why add another category like CSR when we should be moving towards the core supply chain metrics of total delivered cost and customer service.
Vendor Managed Inventory processes–once hailed as the panacea of demand sensing–largely operate in isolation within sales organizations (of the thirty-three organizations that we interviewed last year, no market leader has connected these demand signals). I remember December 2007 like yesterday. They are not. Reflection.
Avaya has been a Kinaxis customer since 2007 and has generated tremendous value from the use of RapidResponse. Over the past several years we have focused on either configuring RapidResponse to help us manage supply, demand, S&OP, product cost reduction and most recently inventory.
In 2007-2014 Terra added inventory management, multi-tier demand sensing, transportation forecasting, and long-term forecasting. Lora has written the books Supply Chain Metrics That Matter and Bricks Matter , and is currently working on her third book, Leadership Matters.
It pains me to see nine out of ten companies are stuck at the critical intersection of cost and inventory turns. For example, in the recession of 2007, DuPont missed the downturn in the market. In a similar vein, their forecasts for the automotive market would have been on new automotive sales and dealer inventory.
Ensure continued alignment by sharing inventory turns as a KPI. Figure 1 shows it for inventory and service. The idea is that more service, typically comes with a higher inventory (or lower turns). They increase the service but require a higher inventory. It will lower cost but increase inventory or decrease turns, cfr.
Rapid cost increases, interest rate hikes and reduced demand require more effective inventory management and forecasting attention. What the last recession taught us An article from McKinsey & Company (2022) analyzed the performance of about 40 publicly traded distribution companies during the 2007-2009 recession.
Many metrics can be used to determine the top 3PL warehousing companies, such as company revenue, the number of warehouses, total warehouse square footage , etc. This compilation is based on the most currently available company revenue data (between 2018 and 2020) without factoring in any other metric. Revenue: $8.17
During supplier selection, companies should apply appropriate procedures and use suitable metrics to select suppliers that align with the company’s ESG policies and broader values. Rethink inventory management strategy Sustainability and optimal inventory levels go hand in hand.
It was the world’s largest VC firm in 2007 with over $20 million in assets during the year. A thorough understanding of metrics that prove out business models. You must be able to manage inventory turnover seamlessly and prevent stockouts. New Enterprise Associates is an American-based VC firm. Scalable order fulfillment.
inventory turns, while the Laggards achieve only 3.8. metrics that really impact the bottom line; the Leaders in our survey. ► 2007. (4). Supply chain Leaders. deliver on time in full (OTIF) on 95.7% of occasions and have an. impressive 15.3 That means greater efficiency and customer satisfaction without. ► 2008. (7).
Supply chain resilience generally means the ability to manage risk and be best positioned to respond and even gain advantage from disruptions (Sheffi, 2007). [1] Resilience is the easy way out – it involves carrying a lot of inventory and redundancies in the supply chain that are wasteful.
Rise in Inventories. Less Effective at Inventory Management. Inventories grew twenty days over the decade. Yes, companies held more inventory (measured in days of inventory) in 2019 than at the start of the 2007 recession. Sadly, most of it is the wrong inventory. Despite spending 1.1% Mistake #3.
Colgate outperformed P&G in Return on Invested Capital (ROIC), and P&G exceeded Colgate in inventory turns. ” So, I started work with Arizona State University to take balance sheet data from 2003-2007 to analyze which combination of metrics drove the highest market capitalization. Schneider Electric Strategy.
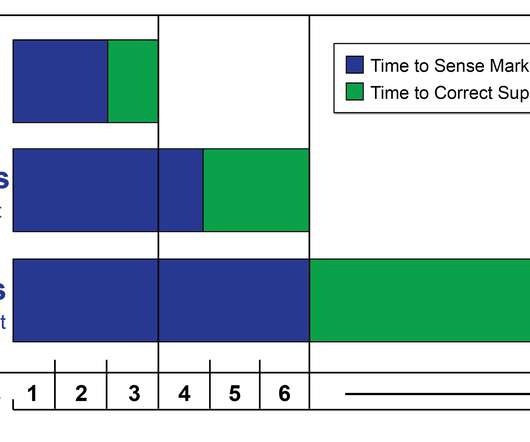
Time to Sense Market Shifts in the 2007 Recession. Simplistic thinking of trading-off customer service, inventory and cost became much, more complicated with the shifts in asset strategies. With greater pressure on shorter cycles and less asset availability, getting good at inventory processes increased. The second issue?
Van Gundy believes the corporate landscape is different from what it was in the early 2000s and during the Great Recession of 2007-2008. Where in the past they might have focused primarily on days payable outstanding (DPO) as a financial metric, they’re now giving equal attention to days sales outstanding (DSO) and inventory levels.
Both Kimberly-Clark and P&G are going backwards on operating margin while making progress on inventory turns. P&G’s rate of improvement on the Metrics That Matter was lower than the peer group. As the company spiraled in the updraft of the market, it built inventory. billion in inventory charges in April 2001.
When I wrote a summary report at AMR Research in 2007 and 2009, there were two or 6% of the market. In addition, 85% of the vendors in the multi-tier inventory optimization market that I wrote about in 1995, are now part of larger platforms. For the Love of the Cloud. This is a major turnaround. Visualization.
In supply chain planning, we are driven by metrics. We focus on reducing miles driven, making a delivery in hours instead of days, minimizing inventories, or increasing the utilization of our workforce. Ron joined Quintiq in 2007 and leads a marketing team that focuses on global campaigns, partners, and analyst relations.
From our eBook, S&OP in the 21st century , “An audit of 50 corporate spreadsheets in 2007 revealed that 94% had errors… one for $100 million!” That could mean excess inventory sitting in a warehouse, gathering dust or depreciating. I use them all of the time for various needs, with great success.
Seasoned supply chain professionals used the mental model from the recession of 2007 as a guidepost.) Using better math to build an inventory plan for raw materials is a good idea. At the beginning of the pandemic, the forecasted period of disruption of seven-to-eight months. As a result, DDMRP is a fad. These concepts are new.
In comparison, in 2000-2007 the U.S. Blaine Inventory Specialist, Syncron Posted on: Nov, 16 2016 Lora, great article! Financial performance metrics are valuable as they capture the economic consequences of business decisions. companies are reshoring and foreign companies are investing in U.S. That is huge progress to celebrate!
Ongoing disruptions in the Middle East are driving up supply chain costs across energy, transportation, insurance, inventory, and technology. Prepare CFOs for Cost Volatility Ongoing disruptions in the Middle East are driving up supply chain costs across energy, transportation, insurance, inventory, and technology. ( What do you say?
In comparison, in 2000-2007 the U.S. Blaine Inventory Specialist, Syncron Posted on: Nov, 16 2016 Lora, great article! Financial performance metrics are valuable as they capture the economic consequences of business decisions. companies are reshoring and foreign companies are investing in U.S. That is huge progress to celebrate!
In comparison, in 2000-2007 the U.S. Blaine Inventory Specialist, Syncron Posted on: Nov, 16 2016 Lora, great article! Financial performance metrics are valuable as they capture the economic consequences of business decisions. companies are reshoring and foreign companies are investing in U.S. That is huge progress to celebrate!
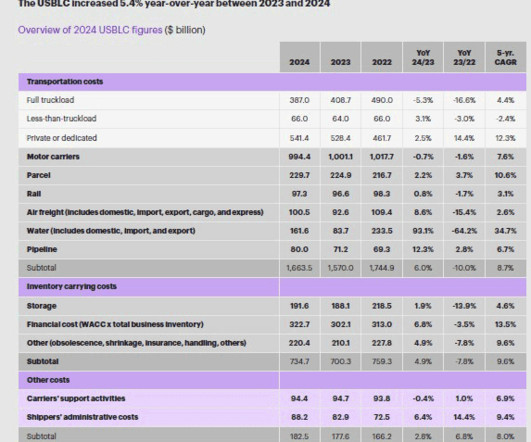
The second component of USBLC, inventory carrying costs (28.4% in 2023), were barely up from 2023 last year under the reports calculation, which includes the cost of warehousing and inventory levels but also the cost of capital (which drives the cost of holding inventory). In comparison, in 2000-2007 the U.S.
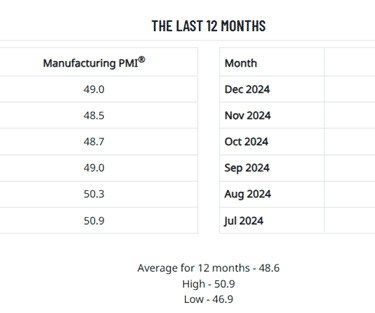
The Inventories Index registered 49.2, meaning companies in total decreased inventory in the month, but at a slower pace. A ‘too low’ status for the Customers’ Inventories Index is usually considered positive for future production.” (See In comparison, in 2000-2007 the U.S. locations to be in close proximity to the U.S.
In comparison, in 2000-2007 the U.S. Blaine Inventory Specialist, Syncron Posted on: Nov, 16 2016 Lora, great article! Financial performance metrics are valuable as they capture the economic consequences of business decisions. companies are reshoring and foreign companies are investing in U.S. That is huge progress to celebrate!
We organize all of the trending information in your field so you don't have to. Join 102,000+ users and stay up to date on the latest articles your peers are reading.
You know about us, now we want to get to know you!
Let's personalize your content
Let's get even more personalized
We recognize your account from another site in our network, please click 'Send Email' below to continue with verifying your account and setting a password.


Let's personalize your content