This site uses cookies to improve your experience. To help us insure we adhere to various privacy regulations, please select your country/region of residence. If you do not select a country, we will assume you are from the United States. Select your Cookie Settings or view our Privacy Policy and Terms of Use.
Cookie Settings
Cookies and similar technologies are used on this website for proper function of the website, for tracking performance analytics and for marketing purposes. We and some of our third-party providers may use cookie data for various purposes. Please review the cookie settings below and choose your preference.
Used for the proper function of the website
Used for monitoring website traffic and interactions
Cookie Settings
Cookies and similar technologies are used on this website for proper function of the website, for tracking performance analytics and for marketing purposes. We and some of our third-party providers may use cookie data for various purposes. Please review the cookie settings below and choose your preference.
Strictly Necessary: Used for the proper function of the website
Performance/Analytics: Used for monitoring website traffic and interactions
In today’s architectures and functional metrics, value optimization does not exist. And, when procurement and tactical planning operate in isolation, there is no decision support framework to guide the trade-offs especially when the functions are tethered to different and conflicting metrics. You are right. The reason?
The use of orbit charts allowed me to see the patterns of performance at the intersection of metrics over time. We purchase data from Y charts. (A As an aside, I do not think that Lenovo is an example of a supply chain excellence. Lenovo posts a 2% average margin compared to the industry average of 6%. but declining.
The industry has had little value from digital transformation and business networks. Most of the business networks were hollowed out by venture capitalists or purchased by opportunists. At the session, we will discuss the choice of metrics for a balanced scorecard to improve market capitalization/employee by industry.
Supply chain excellence is easier to say than to explain. At each company, there is a relationship between the metrics of growth, margin, inventory, customer service, and asset strategy. For the purpose of this article, I will use Return on Invested Capital (ROIC) as the proxy metric to discuss asset utilization.) The reason?
At the Supply Chain Global Summit 2018 , Francois discussed the impact of digitalization, Industry 4.0, The award, based on beating the industry peer group on rate of improvement on the key metrics of growth, operating margin, inventory turns, and Return on Invested Capital (ROIC) while outperforming their peer group, is tough to achieve.
Putting a stick in the eye of the industry is hard work. Or agreement on the definition of supply chain excellence. As a result, functional excellence anchors action. The focus is on digitization—automating today’s processes—versus rethinking process excellence based on the art of the possible. They want to talk.
How Do You Define Excellence? In retrospect, I find that technology is an enabler, but only if we are clear on what defines supply chain excellence. The industry struggles with groupthink. Many believe that an ex-supply chain exec knows the definition of supply chain excellence. I admit it. Lora was as well.
While the industry is flush with terms like digital twin and what-if modeling, current applications were not equal to the need. Initially, the output was published to procurement to design strategic buying strategies. Watermelon Metrics Don’t Drive The Right Results. I love the metaphor of watermelon metrics.
Introduction Gardner, (1954) and Huntzinger, (2007) define Purchase price variance (PPV) as a metric used to measure the effectiveness of cost-saving efforts by calculating the difference between the planned cost (standard pricing) allocated for purchasing activities and the actual cost incurred.
How aligned do you believe your organization is to drive these metrics? Observations on What It Takes In the Mea Culpa post, I wrote that I used to believe that excellence in S&OP was a ratio of 60/30/10. (60% It preceded the crazy M&A activity in the process industries. Who makes the decisions on the trade-offs?
Ed argued that instead of buying new packaging equipment that we should work with R&D to have a base flavor and add the color and flavoring at the head of the machine. Despite goals to improve agility and resiliency, functional metrics for manufacturing efficiency continually throw the supply chain out of balance. The So What?
The solution solved a relevant industry issue. They are industry-specific niche offerings. While there is work within SAP to rethink SNC and use the assets purchased with Ariba to build multi-tier capabilities, the progress is not encouraging. It ceased to exist in 2005 when it merged with 1Sync. Clear governance.
Users are accustomed to building everything in Excel and manipulating the data as needed for their own particular use, typically using static reports or spreadsheets that are siloed in specific departmental needs. A key first step is to have buy-in at the highest level of the organization. Starting at the Top. Other Suggestions.
As companies across industries have discovered, a well-optimized supply chain can drive significant improvements throughout their operations. We’ll examine the key components of efficient supply chains, explore essential performance metrics, and uncover the fundamental drivers that influence efficiency.
I feel that the industry is engaged in ‘Group Think’ No one in this meetings is going to ask tough questions. By purchasing planning and transactional systems for a common vendor, they had one throat to choke and they were familiar with the architectural elements. Of course not… But, the industry is in a group think.
For the past five years, the team at Supply Chain Insights identified Supply Chains to Admire Award Winners by analyzing performance by peer group on the key metrics of growth, operating margin, inventory turns and Return on Invested Capital (ROIC). Diversified Industry Performance For the Period of 2010-2017.
I said, “I am sorry, but I think that the industry needs to face some cold hard facts.” ” The discussions at the event reminded me of dialogue that I heard in other industries a decade ago. This is why I think that the industry needs to get serious about supply chain management. Current State. It matters more.
Millions of shoppers, like my Dad, are not going back to their old habits because there are now faster and more convenient ways for buying daily household needs. It excels on a union of E-Commerce mobile apps and last-mile delivery innovations. With the pandemic, consumer loyalty started bleeding in almost every industry.
With the purchase of i2 by JDA, and Logictools by IBM, manufacturing companies serious about network design started looking for a company, with a well-established community, that was more serious about network design. Most companies are still struggling with “what good looks like” and “what defines supply chain excellence.”
Cash-to-Cash Metrics. Cash-to-cash is a compound metric: (Days of Receivables+Days of Inventory)-Days of Payables=Cash Conversion Cycle. The impact of the elongation of payables on receivables varies by industry, but on average across the industries increased eighteen days when comparing the past five years to the pre-recession years.
It was a story where people believed that functional excellence leads to supply chain superiority. Year after year, well intentioned people toiled against improving metrics that reduced, not improved, the effectiveness of the supply chain. Metrics comparison of Kellogg Co. These technologies are mature. vs. General Mills, Inc.
It is hard work to maintain the status quo in metrics performance. A balanced portfolio of metrics delivers the greatest value. While process industries focus on the efficient supply chain of mass production, marketing strategies focus on late-stage postponement strategies and customization. Most are treading water. Many fail.
Ask yourself, “Are your supply chain metrics bogging you down?” ” To manage a supply chain containing complex dependencies between teams, departments and partner companies across international boundaries requires a rich set of metrics. Functionally isolated metrics lead to sub-optimized supply chain performance.
Think of them as apples and gearseach essential and effective on its own, yet when combined; they create a formidable mechanism for achieving procurement excellence. However, they create an unbeatable duo for procurement excellence. This allows procurement professionals to base their decisions on hard evidence rather than intuition.
As an analyst in the supply chain market for 15 years, I have written many articles on best-of-breed technology companies purchased by a larger company. The Terra Technology investment is one of what we believe will be a series of purchases to build inter-enterprise cloud-based software platforms to redefine supply chain planning.
A process audit report is designed to, ultimately, streamline processes, enhance decision-making and drive overall procurement excellence. Typically, a procurement audit report will review areas such as the agreement of contracts, pricing data and purchase information, financial statements, stakeholder data and supplier performance records.
AMR Research was an industry analyst firm in Boston. Gartner purchased the firm in 2010.) Driving Improvements in Supply Chain Excellence. I did not think that anyone had a clear definition of supply chain excellence. I argued for industry collaboration to define and drive process innovation. I disagreed.
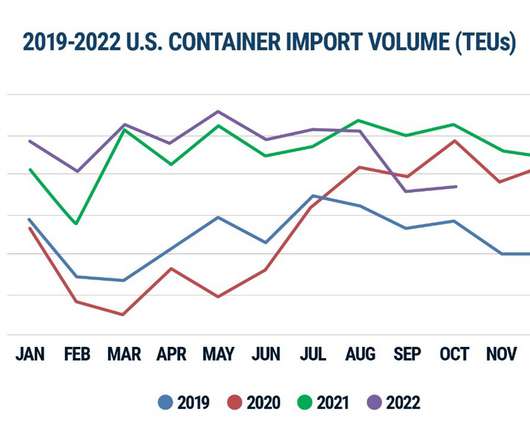
Theme 2: Online buying will fuel home delivery growth, challenges and new strategies. In 2023, consumers will be less forgiving and poised to buy from retailers whose delivery performance is commensurate with the rest of the shopping experience. Figure 1: U.S. Container Import Volume Year-over-Year Comparison. Somewhat nailed it.
The company buying his company, EXE Technologies, is now infamous among those who have followed the WMS market. It was really intended to allow us to buy a few robots and rent some space, just get us started” and prove the business model. We asked for $2 million to buy more robots and then shortly thereafter another $4m.
I will share insights as we go along) The Word Salad Shuffle In the industry, I feel that there is a lot of word salad–consultants and technologists spinning words with little meaning to drive leads. Optimization engines to improve functional metric performance resulted in an exploding number of planners. On average, it takes 2.8
While it is a difficult time, you have to also applaud the heroic efforts of this industry as a whole. It is also helping to bridge the supply chain management gap that has traditionally existed between healthcare providers and other industries such as manufacturing. The Path to Supply Chain Excellence. Share on Twitter.
Nick Lynch is the Global Excellence Manager at Shell Lubricants, a division of Shell Global. Completed in 2012, the ERP project forced the company to standardize organizational design, roles, and metrics. What can often look like compliance in APO could actually be numbers calculated in Excel and posted into the SAP system.
You’ll note in the headline I use the preposition “of” instead of “to” when describing the “journey of Supply Chain Excellence.” The differentiator is whether Supply Chain Excellence is defined as a one-time project or as on ongoing process. Circuit City failed to adapt and is now history.
Modern platforms pull data from a wide array of sources: ERPs, relational databases, Excel files, cloud apps, third-party providers, and beyond. Packaged Analytics, KPIs & Reports Ready-to-use reports, metrics, and dashboards that accelerate time-to-insight. They served a purpose but lacked flexibility and real-time relevance.
I have been an industry analyst since 2001. This week, as I prepare for our second webinar on October 26th at Supply Chain Insights , I am working with Abby Mayer (@indexgirl) to understand the performance of discrete industries over the past decade. We covered the process industries last month.) This industry is High-tech.
The focus is on the role of supply chain finance in driving supply chain excellence. The design of the conference includes tours of several modern warehouses and centers of excellence. The number one question that I am asked today by manufacturers across all industries is “How can I improve customer service?” Background.
This team is not buying the message. So much so, that three years ago, I founded a research company to focus on understanding supply chain excellence. I, like you, spent many years learning from hard work the process industry. When all functions are jointly focused on improving these metrics, then we can have one team.
They each lag in their understanding of supply chain excellence, and are now struggling to build effective supply chain teams. However, most do not realize that the Days of Inventory for the industry has grown 33%. Hosting this webinar series is one of the favorite parts of my job as the Founder of Supply Chain Insights.
I think about this discussion with Keith often as I work on the Supply Chain Index and edit the chapters of Metrics That Matter. Our current processes and dependencies on Excel spreadsheets cannot get us to our goal. Across the industries, this is the case. I think that this industry is poised for a tipping point.
To drive global scale, companies need to design the supply chain to buy globally and execute locally. The company leverages globally sourcing strategies to buy products at a lower cost and then deploys some unique process logic to drive mass customization for retailers. Performance on the Supply Chain Metrics That Matter.
Despite their size, few people outside their industry have heard of them. of in-stock products ship the same business day from our DCs; that is best of breed for any industry.” Driving an excellent supply chain depends on how people are recruited and managed, processes, and the technology used. The Ferguson Supply Chain.
Many companies talk about Supply Chain Excellence, but most leaders struggle to define it. One supply chain leader, in a discussion last week, likened supply chain excellence to fitness. He felt that supply chain excellence was analogous. The results for the high tech and electronics industry is shown in Figure 1.
Available to Promise (ATP) Available to Promise (ATP) is a real-time inventory management metric that tells you how much of a product you can promise to customers without overcommitting. Benchmark against your industry average for best insight. It supports smarter buying by showing which categories or products deliver the best ROI.
“Reach out to other departments about ways to collaborate on sustainability initiatives, and talk to your executive team to gain buy in.” Translating corporate targets into specific team goals and building them into each function’s performance metrics helps embed sustainability into regular workflows.” The post St.
We organize all of the trending information in your field so you don't have to. Join 102,000+ users and stay up to date on the latest articles your peers are reading.
You know about us, now we want to get to know you!
Let's personalize your content
Let's get even more personalized
We recognize your account from another site in our network, please click 'Send Email' below to continue with verifying your account and setting a password.


Let's personalize your content