This site uses cookies to improve your experience. To help us insure we adhere to various privacy regulations, please select your country/region of residence. If you do not select a country, we will assume you are from the United States. Select your Cookie Settings or view our Privacy Policy and Terms of Use.
Cookie Settings
Cookies and similar technologies are used on this website for proper function of the website, for tracking performance analytics and for marketing purposes. We and some of our third-party providers may use cookie data for various purposes. Please review the cookie settings below and choose your preference.
Used for the proper function of the website
Used for monitoring website traffic and interactions
Cookie Settings
Cookies and similar technologies are used on this website for proper function of the website, for tracking performance analytics and for marketing purposes. We and some of our third-party providers may use cookie data for various purposes. Please review the cookie settings below and choose your preference.
Strictly Necessary: Used for the proper function of the website
Performance/Analytics: Used for monitoring website traffic and interactions
The DOE is still issuing large federal loans to startup companies, Novonix a synthetic graphite startup just received a $755 million loan to support its mission and reach its goal of producing 31,500 metric tonnes of synthetic graphite. DOE Issues $755 Loan for Tennessee Synthetic Graphite Facility Novonix has secured a $754.8
Businesses are now managing goods and information across multiple locations, time zones, and partner networks. Orchestration tools help keep everyone working from the same information, reducing the chance of miscommunication between departments or suppliers. In most industries, supply chains have become increasingly complex.
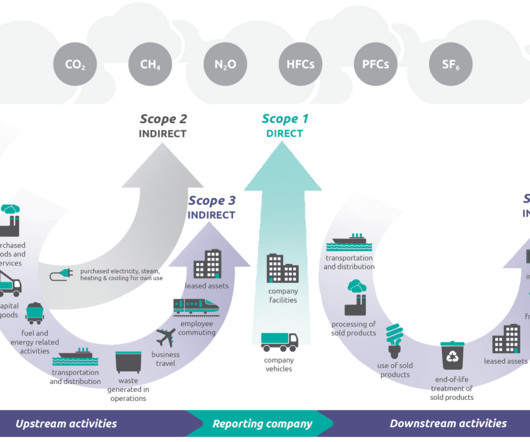
However, as carbon taxes and emissions reporting requirements continue increasing, supply chain professionals face mounting pressures from inside and outside their organizations to measure and improve performance against new, nebulous sustainability metrics. Freight transportation makes up over 10% of total global carbon emissions.
A lack of standardized ESG metrics across industries and regions makes it challenging to consistently evaluate and compare supplier performance. Third-party audits, certifications, and blockchain-based supply chain tracking are being used to strengthen data verification efforts and reduce reliance on self-reported information.
Information on Walmart’s On-Time In-Full program is scattered, so we’ve put together everything you need to know about OTIF. Download this eBook to get the skinny on OTIF metrics, identifying the root cause of issues, and how to improve your scores!
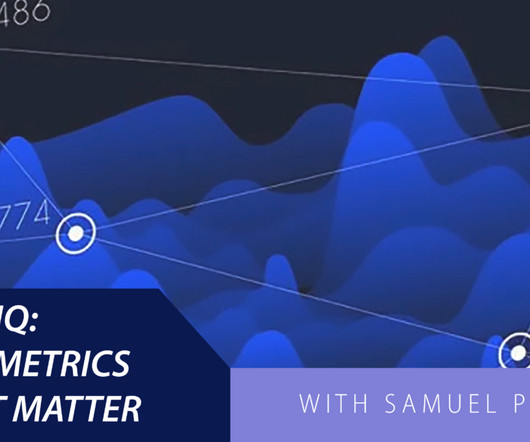
Samuel Parker and Joe Lynch discuss DAT iQ: the metrics that matter. DAT iQ provides freight intelligence to inform your budget and procurement strategies so you can navigate market volatility with greater confidence and agility. Source capacity with precision using supply and demand metrics and forecasts.
This integration includes tracking individual components and collecting data on environmental impact, including sustainability metrics such as carbon footprint and recyclability. Implementing robust data validation processes ensures that all information collected is accurate and reliable.
In an era where information travels fast, companies must proactively disclose their practices, achievements, and challenges. Public Reporting: Publishing sustainability reports and ethical compliance metrics to highlight progress and areas of improvement.
IoT-enabled vehicles generate significant data volumes, requiring robust storage and processing capabilities to manage this information without overwhelming management teams. Protecting sensitive data—such as vehicle locations, driver information, and operational metrics—requires rigorous cybersecurity measures.
As frustrating as contact and account data management is, this is still your database – a massive asset to your organization, even if it is rife with holes and inaccurate information. This buyers guide will cover: Review of important terminology, metrics, and pricing models related to database management projects.
Sustainability is rarely a uniform standardized solution; it requires informed trade-offs and a commitment to aligning corporate goals with broader societal needs. Industry leaders must navigate these intersections carefully, balancing priorities and stakeholder expectations to achieve the most significant impact.
billion rate data points monthly to provide the most comprehensive view of the market, helping you identify savings opportunities and make data-driven decisions.
Schneider Electrics new Environmental Data Program gives logistics professionals unprecedented access to carbon and sustainability metrics, covering over 70% of its product turnover. This move empowers companies to make more informed sourcing decisions, comply with ESG standards, and build greener operations. percent.
When I use the research, I keep the information on the respondent–name, company, title, and individual comments–confidential. Use of Supply Chain Descriptors Most organizations are locked into functional silos driven by functional metrics. The metrics defining success in manufacturing and procurement do not align.
Just by embedding analytics, application owners can charge 24% more for their product. How much value could you add? This framework explains how application enhancements can extend your product offerings. Brought to you by Logi Analytics.
Real-time Market Insights: DAT provides real-time data on spot market rates, capacity availability, and lane-specific trends, enabling informed decision-making. Advanced Analytics Tools: DAT offers sophisticated analytics tools to help users analyze market trends, identify opportunities, and optimize their freight operations.
We consistently see that companies focused on functional excellence–a focus within a functional silo like manufacturing, transportation or distribution– or singular metrics– like inventory or costs– underperform against their peer groups. Reward teams for cross-functional metrics. Customer-Centric Supply Chain.
“If you want to digitize decision-making, you need 100% of the information required for a decision to be made available in a normalized data model. Not all the transactional data, just the data required to calculate a metric or make a decision. We built a technology that allows us to crawl the transactional systems.
Erika is Vice President of Information Security at DAT Freight & Analytics, the largest truckload freight marketplace in North America. Currently Vice President of Information Security at DAT Freight & Analytics, she leads the vision, strategy, and execution of advanced security protections.
Leading organizations are building supply chains that are less exposed to single points of failure, more informed by real-time data, and more able to adjust sourcing, inventory, and routing based on current conditions. Metrics must reflect the new priorities. The Shift Toward Resilience The strategic conversation is beginning to shift.
By harnessing the power of data science and analytics, you can gain end-to-end visibility across your entire network, breaking down information silos and optimizing every stage of your operations. Actionable information for smart decisions. In this post, we’ll explore how data analytics can revolutionize your supply chain.
According to Gartner , early stages of S&OP maturity often lack formal processes, metrics, and cross-functional participation. Gartner also emphasizes the importance of stronger links between S&OP and Sales and Operations Execution (S&OE) processes to ensure timely, informed decisions based on real-world operational detail.
We’ll examine the key components of efficient supply chains, explore essential performance metrics, and uncover the fundamental drivers that influence efficiency. Efficient supply chains strengthen collaborative relationships through automated communication systems and shared performance metrics.
What is the Perfect Delivery Metric? Improving on this metric will always involve a focus on people and processes, but often also includes implementing new, more robust, supply chain applications. The wrong metrics drive suboptimal behaviors and metrics can often be manipulated.
billion rate data points monthly to provide the most comprehensive view of the market, helping you identify savings opportunities and make data-driven decisions.
With this information, are you any closer to knowing what to do about it, or have you just enriched your ability to admire your problem and see it close up? And the linked nature of supply chains mean that collaboration is necessary to ensure that a solution to a problem doesn’t meet the metrics for one link but negatively impact another.
As regulations across the globe strengthen, the pressure to collect, report, and organize emission-related metrics has never been higher. Across the globe, requirements for stricter reporting on complex metrics are increasing. In 2021, 99 percent of S&P 500 companies reported ESG-related information.
For example, if an asset issue was detected, solving that issue could involve multiple applications used by multiple people, seeing different information, entering different data, bouncing emails and texts back and forth, and moving information from one place to another. One event could create so much churn, Mr. Al Syed explained.
The financial teams, and the Information Technology (IT) groups, did not see alignment gaps, but the supply chain teams felt them and viewed them as a critical performance issue. Functional Metrics. To entice you to participate let’s look at the data more closely. Organizational Alignment. The results were striking.
A disruption at any point in the global logistics network including the average of 12 touch points from shipment packaging to final delivery can prove disastrous for profits, service levels, customer loyalty, and other key metrics. With the global e-commerce market predicted to reach $8.1
How are companies rethinking their liquidity management strategies in response to the recent degradation across major working capital metrics? In the wake of economic uncertainty, many companies have experienced a degradation in key working capital metrics.
Like any intelligent system, your LMS is only as smart as the quality of content you feed it and the ability to quantify that information. The latter refers to a single variable standard (SVS), by which one metric, such as cases per hour, is expected to tell all. Solving bottlenecks through informed modifications. Ad infinitum.
The survey’s results suggest a series of misalignments where gaps in process, technology and information flow can be a drag on productivity and optimization. At the simplest level, a buyer might ask a supplier whether the information they have is still up to date. Procurement solutions are often updated with purchased information.
Multi-scenario prediction : Generates diverse forecast possibilities with precise probability assessments for informed decision-making. First, a sophisticated analysis and decision-making process, that incorporates real-time data and requirements.
The formula for OTIF is: Measuring a supply chain against OTIF metrics is a key strategy that helps decision makers attach a tangible value to the success of their fulfillment and allows them to determine key strategies. Timely information is critical, as data older than a few days can lead to costly supply chain disruptions.
When reference data – such as product codes, supplier information, and warehouse locations – is misaligned across systems, it can cause discrepancies in transactional data, leading to inaccurate inventory levels and unreliable performance metrics. Plus, accurate inventory information is the key to optimal decision-making.
Mobile Tablets: Tablets provide real-time order processing capabilities, enabling workers to access information, manage tasks, and update inventory on the go. Understanding key warehouse productivity metrics is essential for evaluating the success of system integration. How does mobile technology improve warehouse efficiency?
For companies that want to go beyond the traditional spreadsheet, which cannot handle this ocean of information efficiently, statistical methods such as cluster analysis can help. Since there are often differences in store sizes, a metric representing the size can be added as well for a two-dimensional clustering approach.
The group’s response is, “Are these supply chain metrics?” ” For many stuck in the myriad of functional metrics, like Operational Efficiency (OEE), Purchase Price Variance (PPV), or transportation cost, a focus on growth, operating margin, inventory turns, and Return on Invested Capital (ROIC) is a stretch.
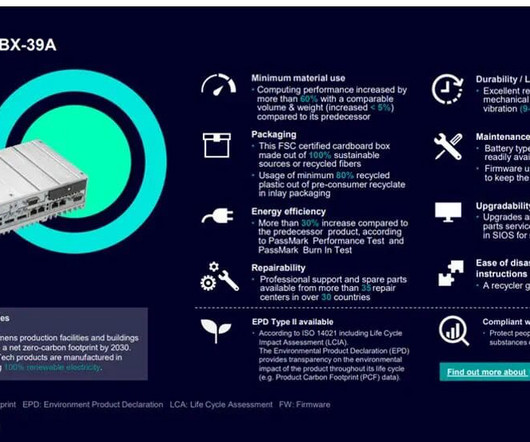
The information in the EPD must be displayed transparently, showing the product’s relevant performance data, which is available via a QR code. It provides customers with auditable data, sustainable achievement metrics, such as energy efficiency, and useful information that can be used for product comparison.
Forward-looking statements are provided for the purpose of providing information about management's current expectations and plans relating to the future. Readers are cautioned that such information may not be appropriate for other purposes.
While procurement operates as a function within the broader supply chain, it has its own set of priorities for strategic sourcing in procurement, performance metrics, and specialized processes. These agreements often include performance metrics, sustainability requirements, and service-level expectations that are continuously monitored.
A collaborative dedicated provider can deliver on critical service metrics and adjust to demand changes, while helping eliminate unfavorable market exposure.” Around-the-clock, anywhere access empowers global operations with advanced metrics and data.
These include: Challenges getting ESG metrics from suppliers, partners, and other third parties. Time-consuming manual processes to report on ESG metrics. They provide information using dashboards and alerts that are easy to understand and allow you to collaborate with not just internal teams, but also with partners and suppliers.
We organize all of the trending information in your field so you don't have to. Join 102,000+ users and stay up to date on the latest articles your peers are reading.
You know about us, now we want to get to know you!
Let's personalize your content
Let's get even more personalized
We recognize your account from another site in our network, please click 'Send Email' below to continue with verifying your account and setting a password.


Let's personalize your content