This site uses cookies to improve your experience. To help us insure we adhere to various privacy regulations, please select your country/region of residence. If you do not select a country, we will assume you are from the United States. Select your Cookie Settings or view our Privacy Policy and Terms of Use.
Cookie Settings
Cookies and similar technologies are used on this website for proper function of the website, for tracking performance analytics and for marketing purposes. We and some of our third-party providers may use cookie data for various purposes. Please review the cookie settings below and choose your preference.
Used for the proper function of the website
Used for monitoring website traffic and interactions
Cookie Settings
Cookies and similar technologies are used on this website for proper function of the website, for tracking performance analytics and for marketing purposes. We and some of our third-party providers may use cookie data for various purposes. Please review the cookie settings below and choose your preference.
Strictly Necessary: Used for the proper function of the website
Performance/Analytics: Used for monitoring website traffic and interactions
In follow-up qualitative interviews, one of the largest issues with organizational alignment was metric definition and a clear definition of supply chain excellence. In my post Mea Culpa, I reference my work with the Gartner Supply Chain Hierarchy of Metrics. Error is error, but is it the most important metric?
These steps include sourcing and receiving inventory, storing inventory, order processing, picking and packing an order, shipping the order, and returns management. Factors like planning tools, inventory management, demand patterns, and innovations in technology contribute to the success or failure of fulfillment optimization.
Suddenly, managing inventory is the name of the game for companies trying to manage working capital and maximize profit while keeping customers happy. And that’s where real-time perpetual inventory signals come in. Plus, accurate inventory information is the key to optimal decision-making.
Picture this: You’re a warehouse manager, and with a few taps on your smartphone, you instantly know the exact location and quantity of every item in your inventory. That’s not science fiction—it’s the power of mobile inventory management. Ready to turn your inventory from a headache into a strategic asset?
This year supply chain leaders will celebrate thirty years of progress in supply chain management; but we have not made progress on one of the funamentals: inventory management. I think that it is time for us to take the litmus test and ask the hard questions, “Have our practices impacted days of inventory? I want to believe.
In the automotive sector, manufacturers are simultaneously reducing inventory costs and delivery times. We’ll examine the key components of efficient supply chains, explore essential performance metrics, and uncover the fundamental drivers that influence efficiency.
Instead, what I observed when I looked at the data, was that most companies that I had worked with (in my role as an industry analyst, I had worked with over 300) were going backwards on margin and inventory turns. Resiliency is the pattern at the intersection of operating margin and inventory turns. “Ugh,” I said.
Make sure that the data is harmonized to ensure all data has the same time reference. The focus is on functional metrics, but are unable to get to overall supply chain metrics. For example, only 29% of manufacturing companies can access total cost data and 31% struggle to see the impact of business decisions on inventory.
But before you start measuring everything in sight – and a few things not in sight – start with a set of thoughtful intentions and questions that will guide you to the right set of metrics and the right set of expectations. Inventory-based KPIs probably make sense for you, but how will you benchmark results? That’s a trap.
Throughout the supply chain, the use of metrics to track and understand processes provides an invaluable resource for ensuring increased production and customer satisfaction. What Distribution Center Metrics Need Tracking? However, the most important metrics can be categorized into the following eight areas. On-Time Shipping.
Closing the gaps happens when there are aligned metrics, clarity of vision and aligned planning processes. More advanced supply chain leaders model the role of complexity (product and customer), the impact of risk, and opportunity of innovation as well as product shipping and manufacturing locations, and inventory policies.
Ensure they have the necessary inventory, marketing materials, and training to effectively introduce your products to the market. Internal Perspective: Performance Monitoring: KPIs and Metrics: Establish key performance indicators (KPIs) to monitor distributor performance. Use data-driven insights to guide these discussions.
Supply chain resilience refers to planning for things that could go wrong and then creating inventory buffers or contingency plans. SCP solutions provide a solid ROI based on hitting targeted service levels with less raw material, work-in-process, or finished goods inventory. This would be a three-way tradeoff.
Here is the list: Supply chain technology implementations have reduced inventory. Here they are: The Lie of Inventory Reduction. Repeatedly, I heard that supply chain applications have saved costs, reduced inventory and improved customer service. ” I played three lies and a truth with the group. The reason? They did not.
Is inventory bloating your costs? Running procurement and supply chain without metrics is like driving blindfolded. A scorecard acts as your dashboard, providing crucial visibility that helps you: Make Data-Driven Decisions: Replace guesswork with facts when evaluating suppliers, processes, and inventory levels.
Days Sales of Inventory (DSI) is a key measure to help you understand how efficient your inventory management is. Here explain what DSI is, how to use it, and why it’s crucial to track this metric in your business – whether you’re a retailer, manufacturer, wholesaler or distributor. How do you calculate Average Inventory?
Not because he lacks vision, but because he has been focusing on the wrong performance metrics for too long. His first realization is that in order to improve the plants performance, he needs new relevant metrics and KPIs. Reference: Goldratt E., Got a comment? Let us know or drop us a tweet @Quintiq. Planet Planning'
The award, based on beating the industry peer group on rate of improvement on the key metrics of growth, operating margin, inventory turns, and Return on Invested Capital (ROIC) while outperforming their peer group, is tough to achieve. The orbit chart below illustrates L’Oréal’s performance at the intersection of two metrics.
To monitor supply chain performance, stakeholders of successful companies typically define supply chain metrics that are relevant to the given business and track these KPIs regularly. By setting benchmarks for metrics, analysts can recognize unsettling trends and take preventive measures on time.
As hospitals adopted consignment planning programs, inventory progress slowed. The turns are the lowest of any industry, and despite investments in technologies and processes, inventory turns have only improved 3%, and Cash-T0-Cash (C2C) cycles have declined 4%. The shift of inventory without the sharing of data is a mistake.
The latter refers to a single variable standard (SVS), by which one metric, such as cases per hour, is expected to tell all. What’s more, because an SVS approach only accounts for one metric at a time, a host of other equally if not more important metrics are bypassed, leaving you largely in the dark. Inventory mix.
I am speaking this morning at the Terra Technology conference and doing a book signing of my new book, Supply Chain Metrics That Matter. In parallel, I have been hard at work on a report on multi-tier inventory optimization for the last two weeks. It is morning in Orlando. The sun is rising. This inbound news adds to the story.
When it comes to the management of inventory in value chains, frustration abounds. Executive, after executive, lament, “They have purchased many technologies and sponsored many projects to reduce inventories, but they are not seeing results.” Inventory is the culmination of many business decisions. Tracking Progress.
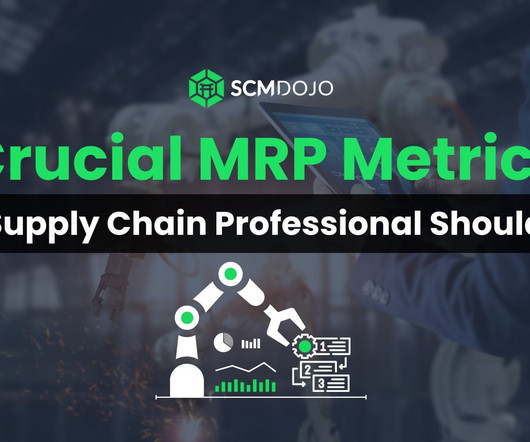
This blog explains The Key MRP Metrics in Supply Chain whcih every supply chain professional in Manufacturing or Distribution Businesses. The metrics that underpin MRP could be described as the balls in this juggling act. This article takes an in-depth look at the crucial metrics every supply chain professional needs to know.
This is often managed with the help of supplier management software or inventory management software. That’s where Procurement Metrics and Key Performance Indicators (KPIs) come into play. Procurement metrics and KPIs allow organisations to measure results and guide best practice performance. Undamaged shipment rate.
Companies with the lower score on the Index are driving faster rates of metrics improvement. Energizer and Unilever are driving the fastest rates of improvement and Clorox and P&G improvement rates are the slowest on the Metrics That Matter of Growth, Operating Margin, Inventory Turns, and Return on Invested Capital (ROIC)).
Well, the chart below illustrates the Level 1 Supply Chain KPIs that I suggested for a company in the past (these are for just one specific industry): For reference: Advantage = the top 20% performers in this sector Parity = the next 30% of organisations Disadvantage = the lower 50% The results in the Blue boxes are a sample company.
Navigating through the turmoil is unprecedented: there are no easy reference models to guide behavior. We find that three factors mattered: organizational alignment, descriptive analytics, and inventory management. Companies driven by functional metrics struggled: they could not adapt quickly to the higher transportation costs.).
Total manufacturing costs showcase how much your company spent to produce its inventory in a given period of time. This is not to be confused with the cost of goods manufactured (COGM), which refers to just the cost of inventory that was finished and prepared for the sale in the period. Notice that it’s direct materials.
in inventory write-down and 20% drop in stock value. Every company today runs on data – the key to using your data is choosing the right metrics for visibility into your supply chain. Management must be cognizant of issues of procurement, manufacturing, inventory, and distribution that impact satisfaction and loyalty.
Reverse logistics refers to all operations related to the reuse of products and materials. Shippers are faced with a variety of challenges: finding the right carriers for the specialized reverse logistics movements, managing costs and inventory, and delivering the desired customer experience.
Koganti urged the procurement audience to look for whats referred to as “foresight function” in planning tools, which is capable of enhancing data analysis, scenario generation and trend identification , allowing for more informed and proactive decision-making, albeit with human oversight.
Fortunately, applying metrics to multi-source operational information that’s stored and managed in a data hubs greatly minimizes these issues. Supply chain metrics provide the intelligence needed to make better projections and more informed choices in such a market. Our Top 24 Supply Chain KPIs & Metrics.
Supply chains have been optimized; warehouse inventory tracking has reached new levels of precision; production lines can operate with virtually no downtime. As the common linchpin that brings together all manufacturing activities, has this metric improved along with all the investment in new technologies?
Proper inventory management can make or break ecommerce brands: Have too much stock and you’ll rack up storage costs and tie up cash flow. That’s why it’s crucial to track inventory management KPIs consistently. . What are KPIs & why are they important for your inventory management? Inventory KPIs.
When companies talk about improving their forecasting, they are most often referring to demand forecasting. As demand forecasting accuracy increases, and the standard deviation associated with the forecast decreases, the need to hold “just in case” inventory also goes down. How much will demand be impacted? This increases sales.
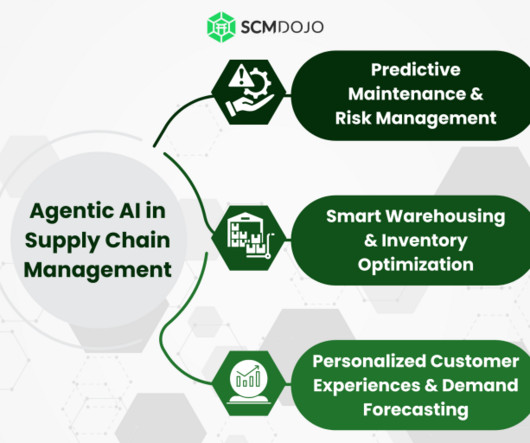
Agentic AI refers to proactive, self-learning systems capable of making independent decisions, solving problems, and continuously adapting to changing conditions. Analyzes IoT sensor data, weather forecasts, and vehicle performance metrics. Automates restocking processes to maintain optimal inventory levels.
Historically these roles are siloed, focused on their own functional metrics. One global pharmaceutical company refers to this as the “whoosh” effect, because switching out the walls between siloes from opaque to clear meant that suddenly everyone could see the same information at the same time, which makes collaboration much easier.
The partnership enables Logility customers to layer in Planalytics’ predictive demand metrics to better understand impacts across their customer base and proactively capitalize on sales opportunities created by favorable weather while mitigating risks when demand is negatively impacted. ATLANTA – Jan. 4, 2022 – Logility, Inc.,
There are a lot of inventory performance measures you could track. These are the 10 most crucial metrics for SMEs – so you can get started on reducing inefficiencies and cutting costs. Explore our live inventory calculators and formulas page. In this article on inventory performance measures.
by Andrew Dunbar So you’re an inventory manager, and your CFO just asked you to reduce inventory by 10% before year end to free up some capital for next year’s big investment in R&D. But then you look at historical trends and see that lately, your inventory has been growing by 3% each quarter.
Companies tightly coupling the budget to S&OP have significantly higher inventories and lower growth than their peer group. Deployment of deeper statistical engines for inventory management with a focus on safety stock will improve inventory levels. Industries carried on average 32 days more inventory in 2020 than in 2007.
I think about this discussion with Keith often as I work on the Supply Chain Index and edit the chapters of Metrics That Matter. In Figure 1, I share a composite orbit chart of progress of Cisco Systems, Intel, Samsung and Flextronics on the Effective Frontier at the intersection of inventory turns and operating margin for 2006-2012.
Note: the same challenges apply for RFP (request for proposal) and RFQ (request for quotation methods, but for simplicity, we’ll just refer to RFI in this article.). 6 Focus on the wrong metric. RFIs also assume the organization is focusing on the right metrics. Seven Ways RFIs Fall Short.
We organize all of the trending information in your field so you don't have to. Join 102,000+ users and stay up to date on the latest articles your peers are reading.
You know about us, now we want to get to know you!
Let's personalize your content
Let's get even more personalized
We recognize your account from another site in our network, please click 'Send Email' below to continue with verifying your account and setting a password.


Let's personalize your content