This site uses cookies to improve your experience. To help us insure we adhere to various privacy regulations, please select your country/region of residence. If you do not select a country, we will assume you are from the United States. Select your Cookie Settings or view our Privacy Policy and Terms of Use.
Cookie Settings
Cookies and similar technologies are used on this website for proper function of the website, for tracking performance analytics and for marketing purposes. We and some of our third-party providers may use cookie data for various purposes. Please review the cookie settings below and choose your preference.
Used for the proper function of the website
Used for monitoring website traffic and interactions
Cookie Settings
Cookies and similar technologies are used on this website for proper function of the website, for tracking performance analytics and for marketing purposes. We and some of our third-party providers may use cookie data for various purposes. Please review the cookie settings below and choose your preference.
Strictly Necessary: Used for the proper function of the website
Performance/Analytics: Used for monitoring website traffic and interactions
For example, if I improve the cost structure in transportation, procurement, manufacturing and sales independently, what decision support framework decides the right trade-offs? In today’s architectures and functional metrics, value optimization does not exist. Align functional metrics to reliability to deliver value.
“To improve,” the report rightly notes, “organizations should enhance supply chain visibility with robust data and analytics; use AI to foresee disruptions; keep business continuity plans current; and diversify supply sources, suppliers, manufacturing and logistics partners.” net promoter score or similar metric) as a supply chain KPI.
However, as carbon taxes and emissions reporting requirements continue increasing, supply chain professionals face mounting pressures from inside and outside their organizations to measure and improve performance against new, nebulous sustainability metrics. Freight transportation makes up over 10% of total global carbon emissions.
On December 5th, Supply Chain Insights is hosting a small event at Georgia Tech to share the results of a two-year research effort to connect financial metrics by industry to supply chain performance to drive value. Did you know that improvement in the supply chain drives 50-70% of this value metric?
Solvoyo has a metric they call the user acceptance rate. This metric measures the percentage of time the planners accept replenishment, transportation, or inventory plans as they are without any change in the timing of the delivery or the quantity to be delivered. You manufacture stuff. Forecasting is not an actionable item.”
Functional Metrics and the Lack of Alignment to Strategy. Process-based companies continue to focus on manufacturing efficiency (OEE) and discrete on procurement (PPV) without designing the supply chain to balance transportation, manufacturing, and procurement to a balanced scorecard. The Lovefest with Shiny Objects. Guess what?
Scaling manufacturing operations is crucial for business growth but presents unique challenges. Balancing increased demand with consistent quality and controlled costs is difficult but essential for manufacturers looking to expand. Successfully scaling manufacturing requires more than just adding resources.
Transportation, warehousing, and manufacturing collectively contribute significantly to carbon emissions, making these areas critical for meaningful change. Senior leaders must think beyond incremental improvements, embracing systemic innovation to achieve significant environmental impact.
The modern supply chain is a complex network of suppliers, manufacturers, distributors, and customers, all interconnected and reliant on a shared ecosystem of trust and accountability. Public Reporting: Publishing sustainability reports and ethical compliance metrics to highlight progress and areas of improvement.
If you would like to participate in a current research study, we would love your help and participation in the contract manufacturing study. We are trying to assess the value of a network in managing contract manufacturing.) One of the alignment gaps that is growing and is unfortunate is the gap between procurement and manufacturing.
Once upon a time, the world of manufacturing was a relatively stable place. So how does a manufacturer navigate this rollercoaster? According to Gartner , these issues can lead to missed manufacturing deadlines and wasted capital. In fact, recent data shows that manufacturer inventory levels are up nearly 10% year over year.
That’s the power of manufacturing data collection. Manufacturing data collection is your secret weapon for boosting efficiency, cutting waste, and staying ahead of the competition. Manufacturing data collection is your secret weapon for boosting efficiency, cutting waste, and staying ahead of the competition.
The research methodology for the Supply Chains to Admire compares the performance of a company against its industry peer group for the metrics of Year-over-Year Revenue Growth, Inventory Turns, Operating Margin, and Return on Capital Employed (ROCE). For 80% of industries, the supply chain metrics represent more than 40% impact on value.
Flex AI to Support Manufacturing Flow Flex uses artificial intelligence to improve production quality and efficiency in electronics manufacturing. Built-In Sustainability Reporting Some orchestration tools are adding carbon tracking or energy use metrics alongside cost and delivery performance data.
At each company, there is a relationship between the metrics of growth, margin, inventory, customer service, and asset strategy. For the purpose of this article, I will use Return on Invested Capital (ROIC) as the proxy metric to discuss asset utilization.) Supply chain excellence was largely defined as manufacturing excellence.
When a critical Tier-2 supplier is affected by a tariff policy change or regional shutdown, the ripple effects often catch manufacturers by surprise. Metrics must reflect the new priorities. Second, many supply chains still lack visibility beyond Tier-1 suppliers. Finally, rigid fulfillment networks compound the problem.
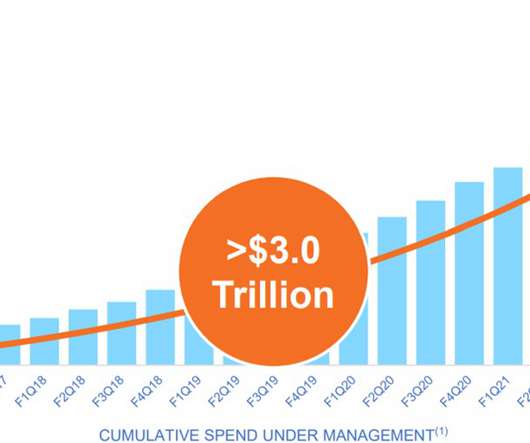
billion rate data points monthly to provide the most comprehensive view of the market, helping you identify savings opportunities and make data-driven decisions.
The first story is about a large regional food manufacturer. The second story is about a regional beverage manufacturer. The companies’ planning was in a vicious cycle where marketing programs were growing increasing error, and the lack of manufacturing modeling made it challenging to see what was feasible. (It The answer?
Which warehouse performance metrics should be tracked? The post 8 Warehouse Optimization Tips from Manufacturing Experts appeared first on RFgen. Track order accuracy, inventory turnover, picking efficiency, space utilization, labor productivity, and shipping accuracy.
Advanced planning evolved with a focus on modeling manufacturing constraints. Watermelon Metrics Don’t Drive The Right Results. I love the metaphor of watermelon metrics. The issue is that traditional functional metrics drive underperformance—the greater the variability, the larger the gap. Over time, this changed.
In the fast-paced world of smart manufacturing, making quick, accurate and informed decisions is essential. Real-time decision-making, powered by artificial intelligence (AI) , is revolutionizing smart manufacturing processes. That said, manufacturers need to take several steps to successfully enable these technologies.
The issue is that when companies optimize functional metrics, they throw the supply chain out of balance and sub-optimize value. There is no unifying data model to align procurement and manufacturing, transportation and distribution, revenue management and demand planning, or sales account teams with supply chain planning.
In the automotive sector, manufacturers are simultaneously reducing inventory costs and delivery times. We’ll examine the key components of efficient supply chains, explore essential performance metrics, and uncover the fundamental drivers that influence efficiency.
Frank, the line manager for manufacturing, dominated the meetings. Despite goals to improve agility and resiliency, functional metrics for manufacturing efficiency continually throw the supply chain out of balance. Strong manufacturing organizations do not make the most effective manufacturers.
We consistently see that companies focused on functional excellence–a focus within a functional silo like manufacturing, transportation or distribution– or singular metrics– like inventory or costs– underperform against their peer groups. Reward teams for cross-functional metrics. What did we find?
In the supply chain team analysis, note the 21% gap between procurement and manufacturing teams, the 35% gap between sales and operations and the 21% gap between finance and operations. Functional Metrics. Organizational Alignment 2012. This seemed bad at the time, but little did I know that it would get worse.
Do Set Clear KPIs and Governance Structures : Establish transparent metrics for sales, coverage, and service levels. Do Invest in Distributor Capability Building : Provide training, digital tools, and performance incentives. A well-equipped distributor is an extension of your brand and a key to market penetration.
Or, the importance of digitalized manufacturing and how digitalization has enabled companies to pivot faster to new and more innovative products, processes or never-produced products needed to save lives in the pandemic. . Identify metrics, analytics and projects to drive business improvements. These became coffee break side bars.
From retail and food and beverage to manufacturing and life sciences, companies from a wide variety of industries are realizing the benefits of the technology, revolutionizing how they operate, collaborate, and generate value. Manufacturers use cloud technology for predictive maintenance, production planning, and supplier collaboration.
In manufacturing, performance improvement, cost reduction and process optimization are crucial. Manufacturers have adopted innovative solutions and technologies to deal with these issues. There is no question that AI and ML will have important roles in shaping the future of manufacturing ERP. What is AI and ML?
For organizations layered in functional metrics and driving a cost agenda, this is a tough nut to crack. Currently, I am working on a study to understand the value of synchronizing contract manufacturing with in-house manufacturing and procurement. Tougher than most understand. Companies participating get a copy of the results.
Forward-thinking organizations have transformed the department into an untapped gold mine that creates value for the entire end-to-end manufacturing process—from design and sourcing to production and delivery. Our latest e-book, “ Is Manufacturing Missing Out On Procurement’s Value Add? Here are some key insights from the e-book.
The formula for OTIF is: Measuring a supply chain against OTIF metrics is a key strategy that helps decision makers attach a tangible value to the success of their fulfillment and allows them to determine key strategies. The ability to meet fulfillment goals is impeded by several issues.
The widespread supply chain disruptions that happened when the global pandemic hit in 2020 highlighted several important lessons regarding manufacturing and supply chain visibility. Powered by the 3DEXPERIENCE platform, DELMIA takes a model-based, data-driven approach by connecting the virtual and real worlds of manufacturing and operations.
Ibrahim Al Syed, the director of digital manufacturing at Celanese, was surprisingly forthcoming about how Celanese developed these capabilities at ARC Advisory Groups 29th Annual ARC Industry Leadership Forum. The company has 55 manufacturing sites across the world. Can I have an industrial Google at a manufacturing facility?
I worked three layers down in the organization for a well-established leader in manufacturing named Dan. Dan had a very manufacturing view and Fred focused on logistics. His goal was to separate manufacturing and distribution inventories to improve his bonus incentives. The metrics were not aligned. You have to do so.
These include: Challenges getting ESG metrics from suppliers, partners, and other third parties. Time-consuming manual processes to report on ESG metrics. From product design, sourcing and operations planning, to manufacturing, logistics and warehousing, there are many opportunities for improved efficiency at each stage of the process.
How do we design work systems to align organizations and ensure that there is the right balance of reward systems with metrics? Is there a need to redesign metrics to move from a functional and traditional function to drive goal alignment? In the design of the digital program, spend time on metrics and reward systems.
Keeping track of all your moving parts in manufacturing is a tall order. That’s where manufacturing inventory management software comes in. In this ultimate guide, we’ll break down everything you need to know about manufacturing inventory management software. Spreadsheets just don’t cut it anymore.
Supplier Collaboration: Fundamental to Elevating Manufacturing Performance Supplier relationships are at the heart of manufacturing performance. That’s why supplier collaboration—that consistent, trusted, and responsive interaction between supplier and manufacturer—is pivotal to manufacturing success.
Overcoming the challenges of making company-wide manufacturing operations more customer-driven requires a clear definition of success. Accurate, real-time production visibility improves product quality, order accuracy, and customer satisfaction while driving down manufacturing costs at the plant level.
They can then use the data to provide an apples-to-apples benchmark on a variety of innovative supply chain metrics applicable to the grocery supply chain. In other words, if manufacturers cannot deliver everything that retailers are ordering, then there is a service failure. Forecasting Accuracy Was Terrible . 2020 was different.
Combine data from: Enterprise Resource Planning (ERP) systems Transportation Management Systems (TMS) Warehouse Management Systems (WMS) Internet of Things (IoT) sensors Supplier portals Customer relationship management systems (CRM) Performance Metrics and KPIs Performance metrics measure how effective your supply chain is.
I can recall a case study when I was in business school where a profitable, fast-growing manufacturer nonetheless went out of business. The Rule of 40 was popularized by venture capitalists in recent years as a key performance metric for SaaS firms. on this metric. The problem? Their cash flow did not keep pace with their sales.
We organize all of the trending information in your field so you don't have to. Join 102,000+ users and stay up to date on the latest articles your peers are reading.
You know about us, now we want to get to know you!
Let's personalize your content
Let's get even more personalized
We recognize your account from another site in our network, please click 'Send Email' below to continue with verifying your account and setting a password.


Let's personalize your content