This site uses cookies to improve your experience. To help us insure we adhere to various privacy regulations, please select your country/region of residence. If you do not select a country, we will assume you are from the United States. Select your Cookie Settings or view our Privacy Policy and Terms of Use.
Cookie Settings
Cookies and similar technologies are used on this website for proper function of the website, for tracking performance analytics and for marketing purposes. We and some of our third-party providers may use cookie data for various purposes. Please review the cookie settings below and choose your preference.
Used for the proper function of the website
Used for monitoring website traffic and interactions
Cookie Settings
Cookies and similar technologies are used on this website for proper function of the website, for tracking performance analytics and for marketing purposes. We and some of our third-party providers may use cookie data for various purposes. Please review the cookie settings below and choose your preference.
Strictly Necessary: Used for the proper function of the website
Performance/Analytics: Used for monitoring website traffic and interactions
While past efforts focused on meeting compliance requirements, organizations are now working to proactively embed environmental, social, and governance (ESG) principles into their sourcing, production, and distribution activities. Without common definitions, ESG assessments can be inconsistent or incomplete.
Each step must be approached methodically to ensure a successful and secure implementation that meets regulatory requirements and enhances operational transparency. The selected technologies must not only meet current needs but also provide scalability and flexibility for future growth.
Public Reporting: Publishing sustainability reports and ethical compliance metrics to highlight progress and areas of improvement. By transitioning to renewable energy sources, companies can significantly reduce greenhouse gas emissions while meeting regulatory requirements and enhancing their corporate image.
The research methodology for the Supply Chains to Admire compares the performance of a company against its industry peer group for the metrics of Year-over-Year Revenue Growth, Inventory Turns, Operating Margin, and Return on Capital Employed (ROCE). For 80% of industries, the supply chain metrics represent more than 40% impact on value.
In a recent survey with Demand Gen Report, we found 59% of experienced practitioners (those with ABM programs more than a year old) indicated their ABM programs are meeting or greatly exceeding their expectations, while only 45% of novices (those with ABM programs less than one year old) could say the same.
Every day, I got a notecard of meetings to attend. Teams make recommendations based on latent data to their managers, but decisions are often bogged down in meetings and corporate politics. Form and socialize your own hierarchy of metrics. Here is the metrics framework that I am using at present in my outside-in classes.
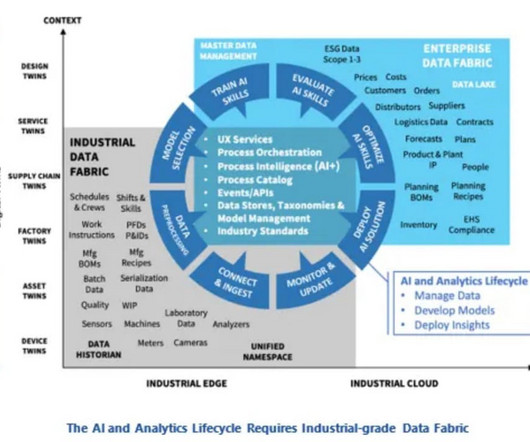
A ‘big bang’ approach, applying a one-size-fits-all AI solution, is not viable in an environment where industrial-grade solutions are needed to meet health, safety, and sustainability goals, Mr. Masson points out. Not all the transactional data, just the data required to calculate a metric or make a decision.
Built-In Sustainability Reporting Some orchestration tools are adding carbon tracking or energy use metrics alongside cost and delivery performance data. Organizations that approach orchestration as a continuous process are better equipped to manage variability, reduce inefficiencies, and meet service commitments reliably.
The logistics and supply chain industry is a critical component of global trade, responsible for moving goods and materials efficiently to meet consumer and business demands. Market Differentiation: Meeting consumer and investor demand for sustainability strengthens brand reputation and market position.
Just by embedding analytics, application owners can charge 24% more for their product. How much value could you add? This framework explains how application enhancements can extend your product offerings. Brought to you by Logi Analytics.
Protecting sensitive data—such as vehicle locations, driver information, and operational metrics—requires rigorous cybersecurity measures. This proactive approach will make fleets more adaptable and dependable, meeting the demands of today’s global supply chain. The post Fleet Management 2.0:
However, exports are now subject to quotas and must meet origin requirements, including “melted and poured” conditions. beef from 1,000 to 13,000 metric tons , removing the 20% tariff within that limit. Further details on derivative product eligibility and quota volumes have not been published.
We consistently see that companies focused on functional excellence–a focus within a functional silo like manufacturing, transportation or distribution– or singular metrics– like inventory or costs– underperform against their peer groups. Reward teams for cross-functional metrics. Customer-Centric Supply Chain.
Standard sizes and categorizations play a crucial role in determining the costs associated with shipping products that meet standard criteria in fulfillment centers. The ability to meet fulfillment goals is impeded by several issues. For suppliers, the penalties associated with missing OTIF goals can be significant.
We’ll examine the key components of efficient supply chains, explore essential performance metrics, and uncover the fundamental drivers that influence efficiency. Effectiveness emphasizes meeting strategic objectives and customer expectations. This post delves into the core drivers of supply chain efficiency.
A shift from functional metrics to a balanced scorecard. I like the use of growth, margin, inventory turns, Return on Invested Capital, customer service and ESG metrics. The focus on functional metrics sub-optimizes balance sheet results. Funny, isn’t it? Not Paying Attention to Process Latency. The result?
These breakdowns accumulate and threaten the ability to meet delivery commitments. For instance, metrics like cycle time reveal how long it takes to complete each unit, helping teams identify steps that slow down output. Conclusion Meeting production deadlines depends on more than speed.
Watermelon Metrics Don’t Drive The Right Results. I love the metaphor of watermelon metrics. In most organizations, there is a dashboard of functional metrics that shows all of the functions operating in the “Green” or acceptable levels until it comes to customer service. What are functional metrics?
How aligned do you believe your organization is to drive these metrics? Leaders align metrics and processes to focus on customer service reliability and hold all teams accountable for a balanced scorecard of Growth, Operating Margin, Inventory Turns, Return on Invested Capital (ROIC), and Orders Filled On-time and Complete (OTIF). (
My Monday morning staff meetings could have been a Saturday night live skit. Frank, the line manager for manufacturing, dominated the meetings. Despite goals to improve agility and resiliency, functional metrics for manufacturing efficiency continually throw the supply chain out of balance. The So What?
The meeting is on everyone’s calendar. There is an abundance of pastries flowing from the basket, and the stage is set for an impactful meeting. Even though things seem to be going well (all of the meeting details are well-executed and the speaker is giving an energized presentation), the room is eerily quiet.
Meeting the market needs of COVID-19 caused organizations to rally, work together, and build a better supply chain through brute force. Use data and new metrics systems to free the organization from the ball and chain of corporate politics. The So What? Let’s Give Science a Chance. It is a time when we can build better.
We talk about the move from functional metrics to a balanced scorecard, but we don’t use a balanced scorecard as an objective function. The blue in Table 4 highlights underperformance, while the yellow highlights mark the companies meeting the criteria for both analyses.
If you don’t, you risk choosing the wrong distributor partner and, for example, the market entry fails to meet expectations. Internal Perspective: Performance Monitoring: KPIs and Metrics: Establish key performance indicators (KPIs) to monitor distributor performance. Maintain a positive and productive relationship with distributors.
How are companies rethinking their liquidity management strategies in response to the recent degradation across major working capital metrics? In the wake of economic uncertainty, many companies have experienced a degradation in key working capital metrics.
We speak about the need to move from a functional understanding to a global, holistic capabilities, but the traditional supply chain leader defines bonus incentives and process performance goals based on functional metrics. Measurement. Organizations speak of the bullwhip, but don’t measure it or monitor the effects.
A responsive supply chain can help to ensure that you always meet customer demand, even if you face inevitable obstances. Performance Management Having just three key metrics at each organisational level is a good idea for performance management in logistics. what we found was shocking.
Combine data from: Enterprise Resource Planning (ERP) systems Transportation Management Systems (TMS) Warehouse Management Systems (WMS) Internet of Things (IoT) sensors Supplier portals Customer relationship management systems (CRM) Performance Metrics and KPIs Performance metrics measure how effective your supply chain is.
For organizations layered in functional metrics and driving a cost agenda, this is a tough nut to crack. Abandon the processes focused on multiple layers of meetings to improve collaboration of organizations that are not aligned, but focused on transactional data. Tougher than most understand. History is a poor guide for the future.
In the early 2020s, Microsoft’s transportation and logistics team needed to meet growing demand for cloud services while managing carbon, cost and cycle time. A clear goal needs to be combined with good data and metrics. Users can only take action once they have the goal, visible data, and metrics.
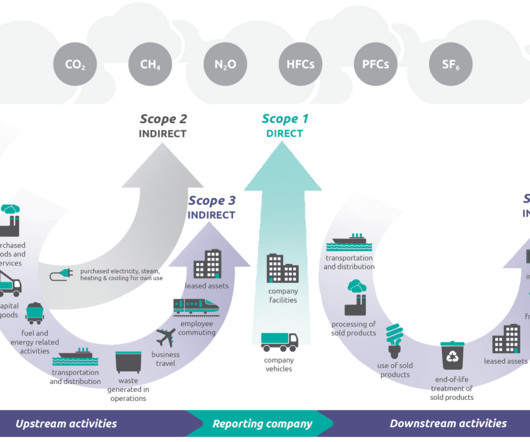
As regulations across the globe strengthen, the pressure to collect, report, and organize emission-related metrics has never been higher. This will urge companies to verify their emissions upstream, internally, and downstream to meet regulatory needs and the increased demands for verifiable data for their downstream customers.
One of my stark realizations this year is that smaller companies are beating larger and often more established companies on growth metrics, inventory turns, operating margin, and Return on Invested Capital (ROIC). (In The metrics selection resulted from work with Arizona State University in 2013.) Look for the full report next week.).
Despite legislation, in 2022, the world generated 62 million metric tons of e-waste, according to the United Nations Global E-waste Monitor. million 40-metric-ton trucks which, if placed bumper-to-bumper, would form a line long enough to wrap around the equator. This waste could fill more than 1.5
These ABC segments can also be used for setting up service level targets or availability targets which then determine the safety stocks for ensuring there are enough stocks to meet the fluctuating demand for those groups of products that are critical to business. However, using metrics that can be easily tracked and updated is recommended.
Dependencies on suppliers who cant meet increased demand can lead to material shortages and production delays. Production Capacity Analysis While traditional testing methods can be time-consuming and offer incomplete data, focusing on key production metrics within the manufacturing process provides more actionable insights.
I am embarrassed to ask, but we were discussing the topic at our board meeting yesterday, and I must admit that we have more confusion than clarity.”. The focus is on functional metrics, but are unable to get to overall supply chain metrics. What is an easy definition? For me, this type discussion is the norm. Design Thinking.
Ultimately, what KPIs, as metrics and indicators derived from the set of plans are taken into account and prepared for each scenario. In essence, this includes the entire chain of supply, production, storage, distribution and finally, the customer, so that the plans make sense all involved parties. Technology for Effective Planning.
A project focus where each project has to meet a threshold ROI has not worked. Aligned Metrics. To ensure the management of the complex system, the metrics of operating margin, inventory turns, ROIC, customer service, revenue, and forecast accuracy need to be managed together as a non-linear system. Supply Chain Design.
Identify metrics, analytics and projects to drive business improvements. When science and the digitalization of manufacturing meet on the factory floor, it leads to what Scott Galloway of NYU Stern says: “Coronavirus is the great accelerator”. One place to start is in assembling a well-represented, well-formed steering committee.
A planner could ask the SCP engine to achieve 95% service, with CO2 emissions under a million metric tons at a given factory in the coming month. The ability to meet that demand can be less than expected. This would be a three-way tradeoff. No plan is perfect. Demand will be higher or lower than expected. Medium-term planning.
The goal is to produce an integrated plan that meets the strategic goals of the overall organization. The goal is to match projected demand over the coming quarters with the ability of the organization to produce products that meet that demand. With a connected plan those effects are made visible to other business functions.
And the linked nature of supply chains mean that collaboration is necessary to ensure that a solution to a problem doesn’t meet the metrics for one link but negatively impact another. Latency kills agility, because by the time the spreadsheet you need lands in your inbox the situation has likely already changed.
Influence Sourcing Decisions Informed Supplier Selection: S&OP provides procurement teams with a comprehensive view of future demand, enabling them to select suppliers with the capacity and capabilities to meet anticipated requirements. Keep Reading to unlock a 50% discount code!
Supply chain reports are data-driven documents that provide key metrics and insights into various aspects of your supply chain, including: Inventory Levels Tracking stock levels in real-time to ensure adequate inventory to meet demand while minimizing holding costs. What are Supply Chain Reports? defects, damage, non-conformance).
We organize all of the trending information in your field so you don't have to. Join 102,000+ users and stay up to date on the latest articles your peers are reading.
You know about us, now we want to get to know you!
Let's personalize your content
Let's get even more personalized
We recognize your account from another site in our network, please click 'Send Email' below to continue with verifying your account and setting a password.


Let's personalize your content