This site uses cookies to improve your experience. To help us insure we adhere to various privacy regulations, please select your country/region of residence. If you do not select a country, we will assume you are from the United States. Select your Cookie Settings or view our Privacy Policy and Terms of Use.
Cookie Settings
Cookies and similar technologies are used on this website for proper function of the website, for tracking performance analytics and for marketing purposes. We and some of our third-party providers may use cookie data for various purposes. Please review the cookie settings below and choose your preference.
Used for the proper function of the website
Used for monitoring website traffic and interactions
Cookie Settings
Cookies and similar technologies are used on this website for proper function of the website, for tracking performance analytics and for marketing purposes. We and some of our third-party providers may use cookie data for various purposes. Please review the cookie settings below and choose your preference.
Strictly Necessary: Used for the proper function of the website
Performance/Analytics: Used for monitoring website traffic and interactions
To build an outside-in model, and use new forms of analytics, we must start the discussion with the question of, “what drives value?” ” Traditional planning models optimize functional processes to improve cost and customer service. You are right. This is an opportunity.
However, as carbon taxes and emissions reporting requirements continue increasing, supply chain professionals face mounting pressures from inside and outside their organizations to measure and improve performance against new, nebulous sustainability metrics. Freight transportation makes up over 10% of total global carbon emissions.
Solvoyo has a metric they call the user acceptance rate. This metric measures the percentage of time the planners accept replenishment, transportation, or inventory plans as they are without any change in the timing of the delivery or the quantity to be delivered. You don’t act on a forecast; you act on what you purchase.
Procurement and supply chain management are often used interchangeably—but in practice, the lines between them can blur in ways that create real friction. Misaligned priorities, siloed systems, and unclear ownership can directly impact key performance indicators like cost savings percentage and procurement cycle time.
Many large organizations have multiple systems for order, warehouse, or transportation management that are barely integrated frequently not at all. Ability to Meet Fulfillment Goals According to the survey, only a mere 1% of respondents achieve 80% or higher for their OTIF metrics, with the average percentage of OTIF being a mediocre 62.21%.
Road freight alone accounts for approximately 7% of global CO2 emissions, with maritime and air transport further amplifying the environmental burden. Key strategies include: Electrification of Transport: The use of electric vehicles (EVs) for freight and last-mile delivery reduces emissions and operational costs.
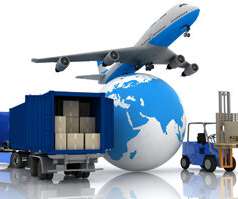
A disruption at any point in the global logistics network including the average of 12 touch points from shipment packaging to final delivery can prove disastrous for profits, service levels, customer loyalty, and other key metrics. With the global e-commerce market predicted to reach $8.1
Next Steps: Start to model demand based on market data to align the organization on baseline demand. Resist the temptation to place deeper analytics on top of existing data models. Instead, rethink the model and the approach. Out of desperation, they turned to the use of descriptive analytics. Next Steps.
We trudge on with our top posts from our main blog categories by page view for all of 2014 from the Cerasis blog by featuring another area Cerasis is an expert in: Transportation. These tips include how you yourself can better manage your transportation department and maximize resources. Read the Full Blog Post.
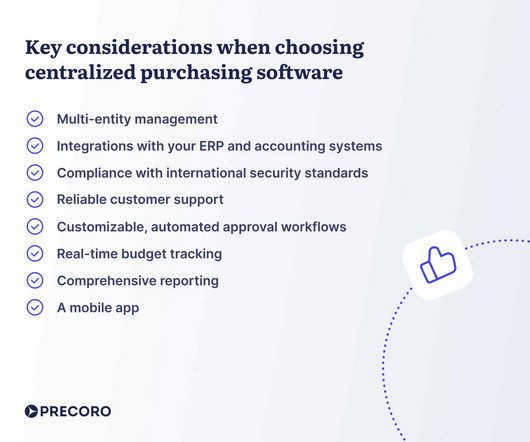
For most CPOs and CFOs, deciding on the right purchasing setup — centralized or decentralized — is no small task. Each model has its perks, and choosing the best fit can feel like walking a tightrope. Keep reading to learn: What is centralized purchasing? What is centralized purchasing?
Procuringtransportation for freight is much different than any other procurement category. Transportationprocurement needs to support both customer service and a company’s internal supply chain goals. One master of freight procurement is Kyle Masters. Procurement ran a request for proposal event.
Supply chain efficiency is the cornerstone of success and involves the effective management of processes, resources, and technologies from procurement to production, transportation to warehousing. In the automotive sector, manufacturers are simultaneously reducing inventory costs and delivery times.
When it comes to executing mode-specific freight moves from origin to destination efficiently, reliably, and cost-effectively, transportation execution and visibility solutions play a critical role. Transportation execution solutions allow shippers to connect to multiple carriers and then tender, track, and pay in the system.
What is procurement? In simple terms business procurement is the process of locating and acquiring goods and services from external sources for the business to use. Procurement activities include planning, sourcing, and negotiation, along with risk management, legal and value analysis. Procurement in 2021 and beyond.
Sure, supply chain cost reduction is important in reducing the cost of goods sold (COGS) and increasing profit, but there are other measurements which should not be forgotten. 3 Key Metrics for Measuring Supply Chain Performance Beyond Cost Reduction. 10 Soft Metric Considerations in Measuring Supply Chain Performance.
Throughout the supply chain, the use of metrics to track and understand processes provides an invaluable resource for ensuring increased production and customer satisfaction. What Distribution Center Metrics Need Tracking? However, the most important metrics can be categorized into the following eight areas. On-Time Shipping.
As an old gal, with over forty-years of supply chain experience, writing this report for ten years taught me many lessons. I find in the orbit chart analysis that 45% of companies in the report are unconsciously incompetent. The group’s response is, “Are these supply chain metrics?” I admit it.
Some logistics involves transportation or warehouses or both. We had a great turnout with over 250 logistics managers, supply chain officers, and those in the transportation world registering and attending the webinar. There are countless number of logistics service providers who offer many different types of broad and niche services.
To monitor supply chain performance, stakeholders of successful companies typically define supply chain metrics that are relevant to the given business and track these KPIs regularly. By setting benchmarks for metrics, analysts can recognize unsettling trends and take preventive measures on time.
Some supply chain companies are leaning on the power of analytics to help streamline their processes and get ahead of their competitors. But many companies have struggled to embrace the relationship between using analytics and implementing changes that can improve business performance. The simpler the model, the more likely the use.
Lower-income consumers and those using food assistance programs care the most about food waste as a purchase driver—again, suggesting it is a response to higher prices.” The same “If” statement was repeated for a host of financial and operational metrics.
In other words, manufacturers need analytics from point-of-sale systems, transportationmetrics and more. Essentially, this creates a stronger level of customer service, and it can turn into additional purchases. Furthermore, companies must extend the buying cycle to get as much information as possible from consumers.
This extensive connectivity has resulted in impressive metrics: 1.2 Key features include Consumer Visibility and Last Mile Connect, built to “enhance the post-purchase customer experience” for retailers and drive Net Promoter Score by providing “advanced delivery communication.”
When you choose a company to transport your freight or to supply you with the materials you need to manufacture a product, you are putting your hard work and reputation in their hands. The next posts in the series will break down metrics and issues to consider in SQM by industry and conclude with a case study on the application of SQM.
Here’s a formula to calculate your total direct materials costs: Beginning Inventory + Added Purchases – Ending Inventory = Total Direct Materials Costs. Direct labor is simply the costs associated with paying people to create the product. Where can I improve processes or purchasing to wisely cut costs or time?
Integrated forecasting, store replenishment, warehouse procurement, purchase order creation, operational constraints such as storage space, unloading capacity, and commercial agreements such as vendor lead times, minimum order quantities, packaging configurations can hugely improve productivity and accuracy in the planning processes.
Cash-to-Cash Metrics. Cash-to-cash is a compound metric: (Days of Receivables+Days of Inventory)-Days of Payables=Cash Conversion Cycle. While touted as a digital procurement provider, it took the Company nine days to onboard me as a vendor, and two weeks to process a Purchase Order. In times of uncertainty, cash is king.
That’s why staying on top of the latest supply chain planning trends is so important – they can make all the difference when it comes to staying competitive, reducing costs, and meeting your customers’ needs. They are more likely to shop for discounts and sales and may delay purchases of some items.
Transportation Networks and Modal Shifts A good transportation strategy is one of the best ways to reduce emissions. This means consolidating shipments to max out load factors, using route optimization algorithms to minimize distance travelled, and shifting to lower emission transport modes. Through network optimization.
Meanwhile, more companies are turning to entities outside of the company, like third-party logistics or integrators (3PLs and 3PIs) to manage omnichannel supply chains , reports Maarten Baltussen of Supply Chain Digital. How to Avoid Supply Chain Technology Hiccups appeared first on Transportation Management Company | Cerasis.
Issuances of common shares, net of issuance costs 3.6 Acquisition of 3GTMS On March 24, 2025, Descartes acquired all of the shares of 3GTMS, a leading provider of transportation management solutions. The purchase price for the acquisition was approximately $112.7 Additions to property and equipment (1.9) Net change in cash (59.7)
Concurrent means to “happen at the same time,” so applying this principle to the supply chain, any change, to any input across the supply chain can be considered and evaluated by demand, supply, distribution, capacity, and purchasing; in real-time. A change to one link (e.g. on-time delivery). A change to one link (e.g. on-time delivery).
Annual Report (SEC Filing) is analyzed and simplified supply chain processes are constructed as below, Supply Chain Planning at Apple Inc. Information from the annual report is also used to produce the Apple Supply Chain Map. Apple Inc purchases raw materials from various sources then get them shipped to an assembling plant in China.
Rising costs, supply chain chaos, and economic swings put businesses under enormous pressure to protect their margins. According to McKinsey & Company, procurement accounts for 50% to 80% of a company’s cost base. That’s why organizations zero in on strategies to achieve procurementcost reduction.
Depending on the nature of your business, your trading partners or your location, this could include procurement strategies, demand planning, logistics, and global trade management among others. Mastering Direct Spend Management Procurement teams generally do not report to the chief supply chain officer.
Digital commerce efficiently requires the digitalization of many customer-facing operations and sourcing and procurement. The First Step: Bring all the data together and ensure analytics and planning can happen on the same platform. . Accurate and timely reconciliation of purchase orders with receipts.
Supply chain management typically does not fit very well with procurement, which is a challenge at the best of times, and can be a disaster in difficult times. It is now a matter of planning the procurement system and the supply management system outside-in and then look at the true demand to minimize the latency.
A Few Important KPIs for Tracking S&OP Performance As a long-time provider of business intelligence applications for manufacturing and distribution businesses, Silvon has played a key role in helping our clients define and implement performance metrics that align their S&OP initiatives with their corporate goals. logistics firms).
Bowman, SupplyChainBrain The European Union is on the verge of rolling out a reporting regulation that promises to have a huge impact on businesses selling into the region. The DPP “represents a significant advance in product transparency and sustainability,” according to an EU report published in September of 2024. “As
The risks associated with chemical manufacturing include the storage and transportation of raw materials, finished products, and waste. They prepare equipment for maintenance, do isolation (disconnect a piece of equipment from the flow of chemicals by closing valves), look at quality or reliability metrics, and do rounds. They must be.
Through the use of connected devices and greater abilities to capture data in real time, the concept of end-to-end visibility and improvement thru the use of supply chain analytics has changed. What Do Supply Chain Analytics Have to Do With This Ability?
Data-Driven Decision Making : Using analytics to continuously refine operations. Key Benefits and Business Impact Warehouse optimization offers significant advantages across multiple areas: Cost Reduction: Expect a decrease in operational expenses, lower labor costs, and reduced energy consumption.
In other words, the simple act of providing reports to executives and upper-level managers could be considered a form of data visualization, and better reporting will be a fundamental improvement in supply chains throughout 2018, explains Craig Guillot of Supply Chain Dive. Service Supply Chains Will Dominant the Market.
Department of Transportation, which has selected 37 projects to be given funds made available by the Bipartisan Infrastructure Law’s (BIL) Mega Program and the Infrastructure for Rebuilding America (INFRA) Grant Program. percent year-on-year decline in cargo ton miles to 1.8bn, although this metric increased by 9.5
We organize all of the trending information in your field so you don't have to. Join 102,000+ users and stay up to date on the latest articles your peers are reading.
You know about us, now we want to get to know you!
Let's personalize your content
Let's get even more personalized
We recognize your account from another site in our network, please click 'Send Email' below to continue with verifying your account and setting a password.


Let's personalize your content