This site uses cookies to improve your experience. To help us insure we adhere to various privacy regulations, please select your country/region of residence. If you do not select a country, we will assume you are from the United States. Select your Cookie Settings or view our Privacy Policy and Terms of Use.
Cookie Settings
Cookies and similar technologies are used on this website for proper function of the website, for tracking performance analytics and for marketing purposes. We and some of our third-party providers may use cookie data for various purposes. Please review the cookie settings below and choose your preference.
Used for the proper function of the website
Used for monitoring website traffic and interactions
Cookie Settings
Cookies and similar technologies are used on this website for proper function of the website, for tracking performance analytics and for marketing purposes. We and some of our third-party providers may use cookie data for various purposes. Please review the cookie settings below and choose your preference.
Strictly Necessary: Used for the proper function of the website
Performance/Analytics: Used for monitoring website traffic and interactions
In today’s architectures and functional metrics, value optimization does not exist. And, when procurement and tactical planning operate in isolation, there is no decision support framework to guide the trade-offs especially when the functions are tethered to different and conflicting metrics. You are right.
When I started this research project, I was busy. One of my lessons learned in completing survey-based research over the past twelve years, is that projects are full of surprises. In my post Mea Culpa, I reference my work with the Gartner Supply Chain Hierarchy of Metrics. Error is error, but is it the most important metric?
According to research by Ernst & Young LLP, the global consulting firm, as the Covid crisis recedes, supply chain executives are losing the strategic gains they made with their C-suite counterparts. The EY research suggests that at many companies, that opportunity is receding. What gets measured affects what gets prioritized.
The DOE is still issuing large federal loans to startup companies, Novonix a synthetic graphite startup just received a $755 million loan to support its mission and reach its goal of producing 31,500 metric tonnes of synthetic graphite.
Just by embedding analytics, application owners can charge 24% more for their product. How much value could you add? This framework explains how application enhancements can extend your product offerings. Brought to you by Logi Analytics.
Proactively adopting cleaner energy sources ensures alignment with these evolving regulations. The industry’s dependency on traditional energy sources necessitates an urgent shift toward cleaner alternatives. Investment in research and partnerships is crucial for scaling these solutions industry-wide.
We’ve seen AI take over everyday tools and search engines; AI in Sourcing and Procurement is becoming a strategic tool in our kit, At Ivalua, we are helping global procurement teams integrate AI across the Source-to-Pay process, bringing automation, insight, and agility to every step. This is where AI can make a huge difference.
The research methodology for the Supply Chains to Admire compares the performance of a company against its industry peer group for the metrics of Year-over-Year Revenue Growth, Inventory Turns, Operating Margin, and Return on Capital Employed (ROCE). Today, companies measure too many metrics without a clear definition of value.
According to my research, top-performing supply chains possess three very different qualities. To help the reader, let’s start with definitions used in our research: Efficiency. In Table 1, from our research, I share ten tactics to consider. Reward teams for cross-functional metrics. Customer-Centric Supply Chain.
In this area of research, I find that companies are like dogs chasing cars. At each company, there is a relationship between the metrics of growth, margin, inventory, customer service, and asset strategy. For the purpose of this article, I will use Return on Invested Capital (ROIC) as the proxy metric to discuss asset utilization.)
Despite goals to improve agility and resiliency, functional metrics for manufacturing efficiency continually throw the supply chain out of balance. However, in my research, I find four factors make the difference (correlations at an 80% confidence level): Supply Chain Leadership. The second step is to align metrics to the strategy.
The relationship between corporate financial performance and supply chain metrics was complex; and in my first attempts, I was unable to derive a correlation. The year 2012 marked the 30th anniversary of the use of supply chain management as a cross-functional process for source, make and deliver in the commercial sector. Definitions.
Even if you’re not you should check out Supply Chain Insights, Supply Chain Metrics That Matter. For the past several years, Supply Chain Insights has been delivering this research series. The research benchmarks A&D companies against other industries and looks at the top five A&D companies over the last decade.
In research study after study, we see that the greatest challenge to achieving supply chain excellence is the understanding of the supply chain by the leadership team. Closing the gaps happens when there are aligned metrics, clarity of vision and aligned planning processes. Metrics Alignment. They lack cohesion.
In my research, I find that the lack of alignment has a direct impact to value (operating margin and market price to book value). Functional Metrics. This maniacal focus on improving functional metrics threw the supply chain out of balance and made the organization less able to work together to solve issues.
In 2011, a research team consists of the experts from University of Michigan and Yahoo, Inc published the article named " Everyone’s an Influencer: Quantifying Influence on Twitter ". Data Collection As you may notice, "retweet" is the key metric for influence measurement and each database adds its own secret ingredients.
Tracking the Metrics that Matter. While Ardent expects Procurement to rise to and tackle these challenges, tracking the metrics that matter will help them stay focused for full recovery. Inflation Metrics. Savings from Sourcing: In 2021, competitive sourcing projects generated an average of 7.7% Risk Metrics.
Integration of corporate social responsibility metrics in planning. Comprehensive view of source, make and deliver. Most often the focus is on transportation or logistics, but does not take into consideration the trade-offs between make, source and deliver. Focus is on make, source and deliver together.
The team was organized around the functional silos of source, make and deliver. So much so, that three years ago, I founded a research company to focus on understanding supply chain excellence. In our work, we tie research from quantitative and qualitative studies to financial results to drive new insights. This is important.
I have worked for Gartner Group, AMR Research, Altimeter Group and now my own company, Supply Chain Insights. Here, I would like to share some background information on the Index and how I intend to use it in developing a higher level of research. It will become one of the cornerstones of our research. How was it developed?
Supply Chain Improvement is based on the work that we completed with an Arizona State University Operations Research team to determine the Supply Chain Index. Attending the conference was Alexia Howard, Senior Research Analyst – US Foods for Sanford C. Aligned Metrics. We find that this is true of too few companies.
It is the end of a two-year research project, and identifies which publicly held companies outperformed their peer group on balance sheet results. Here we share the answers to the questions that we get the most often about this research: What is the source of data? Today we published a new report, Supply Chains to Admire.
In the research, I’m trying to understand the impact of choices—technology, process innovation, and leadership– on balance sheet performance. The research is independent and data-driven. For the past six years, I have analyzed public reporting and triangulated the results to the quantitative research. What have I found?
This week, at Supply Chain Insights LLC, we published our 11th report in the series titled Supply Chain Metrics That Matter. To write these reports, I work with Abby Mayer (twitter: @indexgirl ), Research Associate at Supply Chain Insights. When companies look at singular metrics (labor costs or inventory), they have moved backwards.
Price index and price elasticity are useful metrics on their own, and a combination of these can help determine the right price point to maximize revenue and profit. Since there are often differences in store sizes, a metric representing the size can be added as well for a two-dimensional clustering approach. Asena holds B.S.
In manufacturing-based companies, 70-80% of costs are in the processes of source, make and deliver. While the practices of finance are over 200 years old, in contrast, supply chain as a cross-functional practice (the combination of make, source and deliver) was recently defined in 1982. This research was tough work. The results?
Surprisingly, IT research firm Gartner ranks Apple Supply Chain as the best supply chain in the world for 4 years in a row. Apple Inc purchases raw materials from various sources then get them shipped to an assembling plant in China. Some components are currently obtained from the single or limited sources. Inventory Turnover.
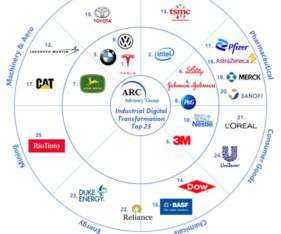
D’Aquila is a director of research at ARC. This orientation is fundamental in determining what KPIs the company values, as many of them are far different from metrics managed by manufacturers relying on traditional views of success.”. Tesla scored the top spot, followed by Intel, BMW, Johnson & Johnson, 3M, and Eli Lilly.
Digital procurement streamlines workflows and unifies data, enabling faster sourcing, better collaboration, and improved accuracy. Digital procurement is the use of digital technologies to enhance, automate, and optimize procurement processes across the entire source-to-pay (S2P) lifecycle.
APQC conducts research on supply chain and logistics to help organizations assess the performance of their own processes and functions compared to their peers. Most recently, the APQC has conducted best practice and benchmarking research on environmental sustainability. Per our survey, 64.2
The research that I have conducted has enabled me to look at this holistically. When I left AMR Research I invested over 400K in building a database of supply chain financial ratios to correlate supply chain results. After three years of research, I have just refined the methodology to start to pull the trends. I am an old gal.
Supply chains must be connected and collaborative so all links can align to business strategy and oriented toward a common set of the most important metrics (and not functional metrics that drive siloed behavior). But to operate at the board level we need to be able to speak the CFO’s language. Spike up to protect against attack.
As product flows rapidly shifted and hard baked assumptions about lead times and sourcing locations were put to test, users across many organizations bypassed their planning systems and turned to excel sheets, internal data science teams or non-traditional supply chain vendors who could deliver AI based solutions at a faster turn.
Last week, after booking an additional $1B in unexpected supplier costs in the third quarter, the CFO led the company’s focus on restructuring to “support efficient and reliable sourcing of components and internal development of key technologies and capabilities.” So, what can Ford and others learn from our current research?
The next posts in the series will break down metrics and issues to consider in SQM by industry and conclude with a case study on the application of SQM. 5 Key Metrics to Use for Scoring Supplier Quality Management (From LNS Research ). The definition of this metric is similar to the way it sounds. Cost of quality.
Source Merriam-Webster Dictionary. As a writer of research on demand-driven supply chains for over eight years, I find many amusing. The first definition of Demand-driven Supply Chains was pushed into the market by AMR Research (now part of the Gartner Group) in 2004. The acronyms keep coming…. The cadence does not stop.
The supply chain is a complex system with finite, and non-linear relationships between supply chain metrics that drive balance sheet results. We find that companies can improve one, but not two of the metrics. Teams struggle to drive improvement in both metrics at the same time. A Look at History. Resiliency.
Financial reengineering focuses on the optimization of short-term results that are usually based on a functional analysis of source, make, or deliver. Few consultants understand the interrelationships between source, make and deliver. Snow fell last night as I worked on my last Supply Chain Metrics That Matter report.
Metrics such as lead-times, forecast accuracy, inventory levels, and service are used to measure operational risks. There may be several nodes that are critical and single sourced thus elevating the risk profile of the supply chain. AI Assistants can also help make managing the process of supply chain design easier.
Their metrics are often misaligned as well – supply chain focuses on service and procurement focuses on the cost of acquiring materials and services. Optimize sourcing: Focus on optimizing sourcing spend across all categories of products. This approach results in inefficiencies, higher costs, and missed opportunities.
I think about this discussion with Keith often as I work on the Supply Chain Index and edit the chapters of Metrics That Matter. This is the clear articulation of when and how to make, source, and deliver for the community. As with all our research, when you share with us, we share with you. Without this, the players are stuck.
To achieve Stage 5, S&OP must be “a fully integrated business planning forum… (where) metrics are value-based and aligned across the network and enterprise to support the required trade-offs.”. Gartner’s research is echoed by Lora Cecere of Supply Chain Insights. She says ERP is “reactive”.
Process: Blueprints for Success This process workstream focuses on blueprinting existing processes, policies, and metrics. As an industry analyst, he researched and advised organizations in various industries on best and innovative practices, digitization and optimization.
To enhance their competitive edge, companies across industries are adopting a key tactic: strategic sourcing. Strategic sourcing is a holistic approach to supply chain management that includes tactics for optimizing the total cost of ownership, improving supplier relationships, and ensuring long-term value creation.
We organize all of the trending information in your field so you don't have to. Join 102,000+ users and stay up to date on the latest articles your peers are reading.
You know about us, now we want to get to know you!
Let's personalize your content
Let's get even more personalized
We recognize your account from another site in our network, please click 'Send Email' below to continue with verifying your account and setting a password.


Let's personalize your content