This site uses cookies to improve your experience. To help us insure we adhere to various privacy regulations, please select your country/region of residence. If you do not select a country, we will assume you are from the United States. Select your Cookie Settings or view our Privacy Policy and Terms of Use.
Cookie Settings
Cookies and similar technologies are used on this website for proper function of the website, for tracking performance analytics and for marketing purposes. We and some of our third-party providers may use cookie data for various purposes. Please review the cookie settings below and choose your preference.
Used for the proper function of the website
Used for monitoring website traffic and interactions
Cookie Settings
Cookies and similar technologies are used on this website for proper function of the website, for tracking performance analytics and for marketing purposes. We and some of our third-party providers may use cookie data for various purposes. Please review the cookie settings below and choose your preference.
Strictly Necessary: Used for the proper function of the website
Performance/Analytics: Used for monitoring website traffic and interactions
To build an outside-in model, and use new forms of analytics, we must start the discussion with the question of, “what drives value?” ” Traditional planning models optimize functional processes to improve cost and customer service. You are right. This is an opportunity.
Enterprise procurement leaders are under more pressure than ever—juggling cost control, compliance, supplier risk, and internal complexity, all while trying to modernize outdated systems. AI, automation, and generative tools are redefining efficiency, allowing procurement teams to move from reactive to proactive decision-making.
Enterprise procurement teams face growing pressure to deliver strategic value – managing supplier risk, ensuring compliance, and supporting sustainability – all without sacrificing speed or control. This blog explores the most common challenges in digital procurement and the capabilities that matter most.
In 2016, we finished a study on continuous improvement. In the study, when we asked for the top elements of business pain to drive continuous improvement for companies greater than 5B$ in annual revenue, as shown in Figure 1, we found the largest issues with cross-functional alignment and availability of talent.
Why do some embedded analytics projects succeed while others fail? We surveyed 500+ application teams embedding analytics to find out which analytics features actually move the needle. Read the 6th annual State of Embedded AnalyticsReport to discover new best practices. Brought to you by Logi Analytics.
Procurement and supply chain management are often used interchangeably—but in practice, the lines between them can blur in ways that create real friction. Misaligned priorities, siloed systems, and unclear ownership can directly impact key performance indicators like cost savings percentage and procurement cycle time.
Strategic sourcing and innovative solutions are often viewed as two distinct procurement tools, but they should not be seen in isolation. Think of them as apples and gearseach essential and effective on its own, yet when combined; they create a formidable mechanism for achieving procurement excellence.
As Procurement teams are tasked to do more with less in an increasingly complex and uncertain market, digitization has become a must. Procurement leaders have increasingly turned to Spend and Supplier Management platforms to improve decision-making, efficiency and collaboration. Payback in under 6 months. Payback in under 6 months.
The award, based on beating the industry peer group on rate of improvement on the key metrics of growth, operating margin, inventory turns, and Return on Invested Capital (ROIC) while outperforming their peer group, is tough to achieve. The orbit chart below illustrates L’Oréal’s performance at the intersection of two metrics.
A disruption at any point in the global logistics network including the average of 12 touch points from shipment packaging to final delivery can prove disastrous for profits, service levels, customer loyalty, and other key metrics. With the global e-commerce market predicted to reach $8.1 billion to $23.07
It is crucial for organizations to understand the importance of Purchase Order collaboration to effectively manage their direct spend, optimize operations, and mitigate risks. From natural disasters to geopolitical tensions and the ongoing COVID-19 pandemic, supply chains have been significantly impacted.
Chances are, if you’re in marketing, sales, or one of the more technical aspects of business, you’ve used predictiveanalytics in some part of your job. But your company doesn’t have to be a retail giant to use predictiveanalytics. using predictiveanalytics?built PredictiveAnalytics in a Nutshell.
The past couple of years has been a remarkable time for e-commerce as more and more consumers have discovered the digital path to purchase. Across industries and regions, people prioritized essentials and reduced impulse purchases. ” Paving the digital path to purchase (i.e., worldwide in 2020, according to eMarketer.”[1]
After two decades of study, I think because it is a lack of understanding. At each company, there is a relationship between the metrics of growth, margin, inventory, customer service, and asset strategy. For the purpose of this article, I will use Return on Invested Capital (ROIC) as the proxy metric to discuss asset utilization.)
However, this approach ignores real purchasing behavior, such as customers buying complete sets of four tires. Probabilistic demand forecasting, in contrast, provides a full probability distribution, revealing actual purchasing patterns and enabling inventory planners to align stock levels with demand realities.
Next Steps: Start to model demand based on market data to align the organization on baseline demand. Resist the temptation to place deeper analytics on top of existing data models. Instead, rethink the model and the approach. Out of desperation, they turned to the use of descriptive analytics. Next Steps.
When shoppers were asked what would put them off making more ecommerce purchases in the future, 21% indicated they’d had negative delivery experiences, 20% said deliveries were not reliable, and 17% were dissatisfied with the delivery process. Similarly, maintaining a strong chain of custody (e.g.,
But, I want to understand this more, and as a result, I have a new study in the field to gain additional insights, and I would love your input. In 2012, I placed the first alignment study in the field. Functional Metrics. To respond, follow this link. To entice you to participate let’s look at the data more closely.
However, this approach ignores real purchasing behavior, such as customers buying complete sets of four tires. Probabilistic demand forecasting, in contrast, provides a full probability distribution, revealing actual purchasing patterns and enabling inventory planners to align stock levels with demand realities.
Wikipedia In 2014, I was exploring methods to publish what is now the Supply Chains To Admire report. The use of orbit charts allowed me to see the patterns of performance at the intersection of metrics over time. For the past decade, I have been studying these patterns. We purchase data from Y charts. (A
But supporting the process with advanced analytics goes even further, contributing to higher levels of productivity and profitability. Like many organizations, Tereos recognizes the use of advanced analytics as an imperative. Advanced analytics as enabling technology. The use of predictiveanalytics is fairly common nowadays.
In the height of the e-commerce craze, the marketplace offerings started with a focus on e-procurement. The widely-held view was that the e-procurement market would fuel the next generation of marketplace applications. The rebirth of marketplace offerings is not on the back of e-procurement or ERP. The debates were heated.
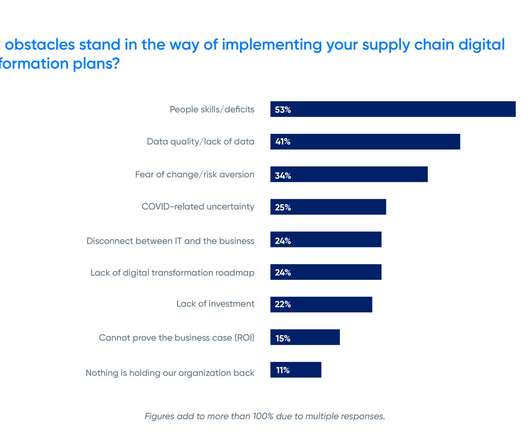
Leaders surveyed in third annual ToolsGroup and CSCMP report are “extremely concerned” about external supply chain threats but lack people to make transformation succeed. Download the complete report: Digital Supply Chain Planning Outlook 2022 ?. That’s why global leaders like Absolut, BP and Harley-Davidson rely on us year after year.
The latest study highlights opportunities for businesses to strengthen resilience with artificial intelligence (AI)-driven demand sensing to optimize inventory, realize more value from planning investments, and better serve clients during disruptions of any size. Orlando, FL – October 2, 2024 – E2open Parent Holdings, Inc.
How aligned do you believe your organization is to drive these metrics? One of my favorite case studies was Campbells in 2014. See the World Kitchen case study in the Agility Report. A good leader knows that cost reductions in the back office does not necessarily improve margins. Is your plan feasible?
In companies, there is no standard model for demand processes. New forms of analytics make new capabilities possible. Many supply chain consultants will quickly rattle off case studies and proof points, but the smart supply chain leader will ground the discussion with clear definitions. Step Up and Learn the Language of Demand.
At the same time, two-thirds (66%) of businesses admitted they were still reliant on such processes as part of their Procurement or supplier management function. At the same time, two-thirds (66%) of businesses admitted they were still reliant on such processes as part of their Procurement or supplier management function.
I think about this discussion with Keith often as I work on the Supply Chain Index and edit the chapters of Metrics That Matter. E2open last week announced the purchase of Serus. This purchase increases E2open’s capabilities for visibility into the processes of the outsourced semiconductor network of foundries.
However, what is clear from our recent study of 73 manufacturers using supply chain planning is that companies using best-of-breed solutions implement faster, achieve a quicker Return-on-Investment (ROI), and are more satisfied. However, this is not supported by the facts of a recent study. (At Study Results. Was it intentional?
After two years of studying corporate balance sheets and talking to supply chain leaders, I now see things quite differently. Which supply chain metrics correlate to market capitalization by Morningstar sector? Embrace new technologies: Internet of Things, new forms of analytics, mobility, etc. Numbers don’t lie.
Retail returns occur when a customer returns the purchased items to a seller in exchange for a refund, store credit, or a similar product. Returns come with plenty of challenges around logistics, inventory, and predicting volatile sales trends. 83% of consumers with a household income of over $100,000 report that returns are important.
I have learned that supply chain systems are more complex than I originally thought, and that the relationships between supply chain metrics are nonlinear. They also enable the evaluation of networks for both sales and procurement relationships to optimize the flows upstream and downstream. And, in our Digital Manufacturing Study.
Experts from North Carolina State University and GEP conducted a survey on supply chain, procurement and IT leaders to determine their challenges and priorities, focusing on examining gaps in the supply chain. The study found that these leaders considered the largest gap to be between supply chain and procurement, citing it as a major issue.
Shoppers coping with inflation have shifted buying habits , purchasing fewer goods and cutting back on big name brands in favor of cheaper alternatives. Behind the scenes, CPG brands are strategically balancing cost cutting measures with supply chain investments to ensure preparedness for continuing market shifts.
I know that your primary focus is procurement. Or planned orders to purchase orders?) In one of the case studies, a manufacturer reported that they had 1700 employees with the term “data” in their title, but they lacked insights. ” Anna, this blog post is for you. And how do we measure it? (Is
Primed for transactional efficiency, these legacy architectures based on relational databases drive order-to-cash and procure-to-pay efficiencies. In a recent study, roughly 1/3 of respondents were familiar or very familiar with the concepts of the Graph Approach. I term this our data jail. The focus of the Gartner Magic Quadrant.)
In other words, manufacturers need analytics from point-of-sale systems, transportation metrics and more. Essentially, this creates a stronger level of customer service, and it can turn into additional purchases. For example, a customer is a shoe store may purchase shoes, but if offered a new brand of socks, he or she refuses.
ARC Advisory Group did a study on the supply chain collaboration network (SCCN) a couple of years ago. In that study, FourKites 2021 revenues were estimated to be $65 million. The company’s customers report that the ETAs provided by these FourKites are more accurate, timely and easier to access than those provided by carriers.
Machine Learning for demand forecasting has matured to a level of accuracy, transparency and replicability that translates into transformative results, including in these five areas: Accuracy, transparency, thoroughness of analytical options and results. Analytical processing speed and accelerated corporate learning.
The consulting team pitches a theme–vision of supply chain best practices, big data analytics, or demand-driven value networks– to the executive team, and a new project is initiated. It was also the preference of the consulting partners because the projects were longer, more costly and better aligned with the consulting model.
Digital commerce efficiently requires the digitalization of many customer-facing operations and sourcing and procurement. The First Step: Bring all the data together and ensure analytics and planning can happen on the same platform. . Accurate and timely reconciliation of purchase orders with receipts.
In May 2022, Ivalua commissioned Forrester to survey over 400 procurement leaders across the globe to ask how they plan to minimize the frequency and impact of supply disruptions. This places limitations on the value that procurement generates for your organization and impacts the resilience and agility of the supply chain.
Supply chain execution is required to distinguish between the high runner purchases and the slower-moving products customers are willing to wait for. In a study of logistics providers conducted by Fraunhofer IML, only 36% of organizations reported having a clear overall plan for digital transformation. The Improved Way.
Key components of mobile inventory management include: Smartphone app: Allows field agents to log information, analyze metrics, and manage tasks even in remote areas with limited connectivity. Cloud software: Stores and distributes real-time data, producing reports accessible to all team members.
We organize all of the trending information in your field so you don't have to. Join 102,000+ users and stay up to date on the latest articles your peers are reading.
You know about us, now we want to get to know you!
Let's personalize your content
Let's get even more personalized
We recognize your account from another site in our network, please click 'Send Email' below to continue with verifying your account and setting a password.


Let's personalize your content