This site uses cookies to improve your experience. To help us insure we adhere to various privacy regulations, please select your country/region of residence. If you do not select a country, we will assume you are from the United States. Select your Cookie Settings or view our Privacy Policy and Terms of Use.
Cookie Settings
Cookies and similar technologies are used on this website for proper function of the website, for tracking performance analytics and for marketing purposes. We and some of our third-party providers may use cookie data for various purposes. Please review the cookie settings below and choose your preference.
Used for the proper function of the website
Used for monitoring website traffic and interactions
Cookie Settings
Cookies and similar technologies are used on this website for proper function of the website, for tracking performance analytics and for marketing purposes. We and some of our third-party providers may use cookie data for various purposes. Please review the cookie settings below and choose your preference.
Strictly Necessary: Used for the proper function of the website
Performance/Analytics: Used for monitoring website traffic and interactions
There was no improvement in the response when compared to the downturn at the start of the 2007 recession. While most all supply chain leaders will shake their heads and agree that a risk mitigation strategy is essential, the practices commonly used are focused on procurement and supplier management. Why does this matter?
Ask a procurement or transportation professional if they have a good demand signal and expect a laugh. Technology can automate role-based views up and down the river of demand for all roles: marketing, sales, finance, manufacturing, procurement, transportation, and human resources. A negative FVA increases cost, inventory, and risk.
The organization failed to anticipate the downturn in the cereal market during the 2007 recession, resulting in a loss of consumer confidence in the organic product segment. They never leveraged their point-of-sale data to detect market shifts, and the supply chain organization prioritized cost reduction. The result?
It evolved from material requirements planning (MRP) and later manufacturing resource planning (MRP II), which were already being used in manufacturing industries to manage production and inventory. It further strengthened its position in procurement and supplier networks with the 2012 acquisition of Ariba.
In comparison, in 2000-2007 the U.S. Blaine Inventory Specialist, Syncron Posted on: Nov, 16 2016 Lora, great article! It does not seem to consider a key indicator in days inventory on hand, which is key to determining a SC company's ability to forecast, manage inventory costs and reduce aged stock.
In comparison, in 2000-2007 the U.S. Blaine Inventory Specialist, Syncron Posted on: Nov, 16 2016 Lora, great article! It does not seem to consider a key indicator in days inventory on hand, which is key to determining a SC company's ability to forecast, manage inventory costs and reduce aged stock.
In comparison, in 2000-2007 the U.S. Blaine Inventory Specialist, Syncron Posted on: Nov, 16 2016 Lora, great article! It does not seem to consider a key indicator in days inventory on hand, which is key to determining a SC company's ability to forecast, manage inventory costs and reduce aged stock.
In comparison, in 2000-2007 the U.S. Blaine Inventory Specialist, Syncron Posted on: Nov, 16 2016 Lora, great article! It does not seem to consider a key indicator in days inventory on hand, which is key to determining a SC company's ability to forecast, manage inventory costs and reduce aged stock.
In comparison, in 2000-2007 the U.S. Blaine Inventory Specialist, Syncron Posted on: Nov, 16 2016 Lora, great article! It does not seem to consider a key indicator in days inventory on hand, which is key to determining a SC company's ability to forecast, manage inventory costs and reduce aged stock.
In comparison, in 2000-2007 the U.S. Blaine Inventory Specialist, Syncron Posted on: Nov, 16 2016 Lora, great article! It does not seem to consider a key indicator in days inventory on hand, which is key to determining a SC company's ability to forecast, manage inventory costs and reduce aged stock.
In comparison, in 2000-2007 the U.S. Blaine Inventory Specialist, Syncron Posted on: Nov, 16 2016 Lora, great article! It does not seem to consider a key indicator in days inventory on hand, which is key to determining a SC company's ability to forecast, manage inventory costs and reduce aged stock.
In comparison, in 2000-2007 the U.S. Blaine Inventory Specialist, Syncron Posted on: Nov, 16 2016 Lora, great article! It does not seem to consider a key indicator in days inventory on hand, which is key to determining a SC company's ability to forecast, manage inventory costs and reduce aged stock.
First published in 2007, this classic reflection contrasts two distribution centers to show how mutual respect drives better results, stronger culture, and lower turnover. This article, originally published in 2007, offers insight into the value that problem-solving brings to corporate culture. In comparison, in 2000-2007 the U.S.
In comparison, in 2000-2007 the U.S. Blaine Inventory Specialist, Syncron Posted on: Nov, 16 2016 Lora, great article! It does not seem to consider a key indicator in days inventory on hand, which is key to determining a SC company's ability to forecast, manage inventory costs and reduce aged stock.
Ongoing disruptions in the Middle East are driving up supply chain costs across energy, transportation, insurance, inventory, and technology. Prepare CFOs for Cost Volatility Ongoing disruptions in the Middle East are driving up supply chain costs across energy, transportation, insurance, inventory, and technology. ( What do you say?
In comparison, in 2000-2007 the U.S. Blaine Inventory Specialist, Syncron Posted on: Nov, 16 2016 Lora, great article! It does not seem to consider a key indicator in days inventory on hand, which is key to determining a SC company's ability to forecast, manage inventory costs and reduce aged stock.
In comparison, in 2000-2007 the U.S. Blaine Inventory Specialist, Syncron Posted on: Nov, 16 2016 Lora, great article! It does not seem to consider a key indicator in days inventory on hand, which is key to determining a SC company's ability to forecast, manage inventory costs and reduce aged stock.
In comparison, in 2000-2007 the U.S. Blaine Inventory Specialist, Syncron Posted on: Nov, 16 2016 Lora, great article! It does not seem to consider a key indicator in days inventory on hand, which is key to determining a SC company's ability to forecast, manage inventory costs and reduce aged stock.
In comparison, in 2000-2007 the U.S. Blaine Inventory Specialist, Syncron Posted on: Nov, 16 2016 Lora, great article! It does not seem to consider a key indicator in days inventory on hand, which is key to determining a SC company's ability to forecast, manage inventory costs and reduce aged stock.
In comparison, in 2000-2007 the U.S. Blaine Inventory Specialist, Syncron Posted on: Nov, 16 2016 Lora, great article! It does not seem to consider a key indicator in days inventory on hand, which is key to determining a SC company's ability to forecast, manage inventory costs and reduce aged stock.
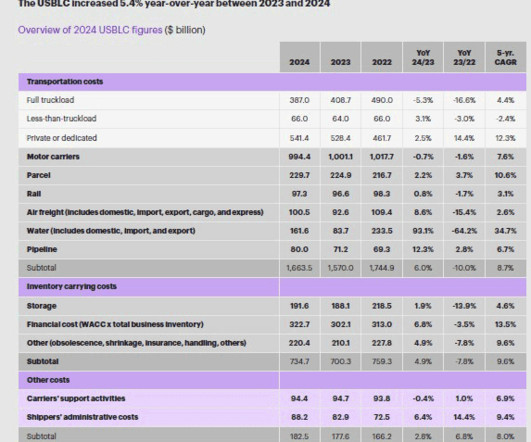
The second component of USBLC, inventory carrying costs (28.4% in 2023), were barely up from 2023 last year under the reports calculation, which includes the cost of warehousing and inventory levels but also the cost of capital (which drives the cost of holding inventory). In comparison, in 2000-2007 the U.S.
In comparison, in 2000-2007 the U.S. Blaine Inventory Specialist, Syncron Posted on: Nov, 16 2016 Lora, great article! It does not seem to consider a key indicator in days inventory on hand, which is key to determining a SC company's ability to forecast, manage inventory costs and reduce aged stock.
In comparison, in 2000-2007 the U.S. Blaine Inventory Specialist, Syncron Posted on: Nov, 16 2016 Lora, great article! It does not seem to consider a key indicator in days inventory on hand, which is key to determining a SC company's ability to forecast, manage inventory costs and reduce aged stock.
In comparison, in 2000-2007 the U.S. Blaine Inventory Specialist, Syncron Posted on: Nov, 16 2016 Lora, great article! It does not seem to consider a key indicator in days inventory on hand, which is key to determining a SC company's ability to forecast, manage inventory costs and reduce aged stock.
In comparison, in 2000-2007 the U.S. Blaine Inventory Specialist, Syncron Posted on: Nov, 16 2016 Lora, great article! It does not seem to consider a key indicator in days inventory on hand, which is key to determining a SC company's ability to forecast, manage inventory costs and reduce aged stock.
In comparison, in 2000-2007 the U.S. Blaine Inventory Specialist, Syncron Posted on: Nov, 16 2016 Lora, great article! It does not seem to consider a key indicator in days inventory on hand, which is key to determining a SC company's ability to forecast, manage inventory costs and reduce aged stock.
That marked the first time the vacancy rate surpassed 7% since 2014, as businesses rushed extra inventory into their existing warehouses earlier this year and then paused decision-making during the Trump administration’s on-again, off-again tariff rollout. In comparison, in 2000-2007 the U.S. in the second quarter from 6.9%
In comparison, in 2000-2007 the U.S. Blaine Inventory Specialist, Syncron Posted on: Nov, 16 2016 Lora, great article! It does not seem to consider a key indicator in days inventory on hand, which is key to determining a SC company's ability to forecast, manage inventory costs and reduce aged stock.
In comparison, in 2000-2007 the U.S. Blaine Inventory Specialist, Syncron Posted on: Nov, 16 2016 Lora, great article! It does not seem to consider a key indicator in days inventory on hand, which is key to determining a SC company's ability to forecast, manage inventory costs and reduce aged stock.
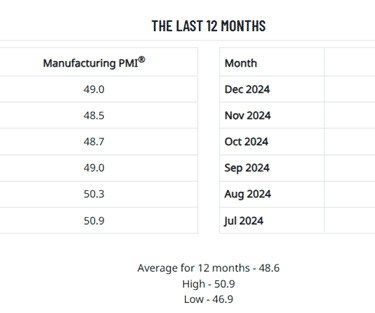
Another manager in the computers and electrics sector stated that: “Tariffs continue to cause confusion and uncertainty for long-term procurement decisions. The Inventories Index registered 49.2, meaning companies in total decreased inventory in the month, but at a slower pace. In comparison, in 2000-2007 the U.S.
Replenishment of the split case locations became the bottleneck, in part because of an issue I still have never seen a great solution for: when volumes for a wave will wipe out a location’s inventory, but the required replenishment exceeds the location’s capacity when it arrives. In comparison, in 2000-2007 the U.S.
In comparison, in 2000-2007 the U.S. Blaine Inventory Specialist, Syncron Posted on: Nov, 16 2016 Lora, great article! It does not seem to consider a key indicator in days inventory on hand, which is key to determining a SC company's ability to forecast, manage inventory costs and reduce aged stock.
In comparison, in 2000-2007 the U.S. Blaine Inventory Specialist, Syncron Posted on: Nov, 16 2016 Lora, great article! It does not seem to consider a key indicator in days inventory on hand, which is key to determining a SC company's ability to forecast, manage inventory costs and reduce aged stock.
In comparison, in 2000-2007 the U.S. Blaine Inventory Specialist, Syncron Posted on: Nov, 16 2016 Lora, great article! It does not seem to consider a key indicator in days inventory on hand, which is key to determining a SC company's ability to forecast, manage inventory costs and reduce aged stock.
The Inventories Index registered 48.9, meaning companies in total decreased inventory in the month, and at a slower pace. In comparison, in 2000-2007 the U.S. Blaine Inventory Specialist, Syncron Posted on: Nov, 16 2016 Lora, great article! below the key 50 level, down 0.3 locations to be in close proximity to the U.S.
In comparison, in 2000-2007 the U.S. Blaine Inventory Specialist, Syncron Posted on: Nov, 16 2016 Lora, great article! It does not seem to consider a key indicator in days inventory on hand, which is key to determining a SC company's ability to forecast, manage inventory costs and reduce aged stock.
In comparison, in 2000-2007 the U.S. Blaine Inventory Specialist, Syncron Posted on: Nov, 16 2016 Lora, great article! It does not seem to consider a key indicator in days inventory on hand, which is key to determining a SC company's ability to forecast, manage inventory costs and reduce aged stock.
Inventory, in this time of uncertainty, is the organization’s most important buffer to protect against variability. However, organizations are not good at managing inventory. Cash-to-cash is a compound metric: (Days of Receivables+Days of Inventory)-Days of Payables=Cash Conversion Cycle. Inventory. My takeaway?
Here at resupply points, inventory was stored for up to 8 days. Larson et al 2007 indicated that, based on a literature review, there are 4 types of interaction as below, Reproduced from Larson et al 2007. (1) Then, Ive created the conceptual model of the news as below, Conceptual Model. to another " is a bit tricky.
Companies tightly coupling the budget to S&OP have significantly higher inventories and lower growth than their peer group. Deployment of deeper statistical engines for inventory management with a focus on safety stock will improve inventory levels. Industries carried on average 32 days more inventory in 2020 than in 2007.
As reported in the article, it appears that inadequate training was a contributing factor in this case too: “After the problems emerged, high-ranking Pratt executives spent weeks on the ground in Londonderry , training UPS workers who were unfamiliar with jet-engine parts [emphasis mine] and working out kinks in the companies’ inventory software.”.
Expect greater variability in lead times and an increase in in-transit inventory. Inventory Management. Tariffs dynamically change the value of inventory, necessitating investment in deeper inventory management solutions. Few are ready to rationalize the differences in the price of inventory on receipt.
Granular data by volume is a must to be able to manage replenishment, network design, and inventory targets. A simplistic view is that supply chain excellence is the trade-off of cost, inventory and customer service. The two primary buffers in the supply chain are manufacturing capacity and inventory. Time horizon. The takeaway?
The wealth of data captured from raw material procurement through distribution to the end customer creates a comprehensive, holistic view of how a supply chain is performing. Since November 2007, Ed’s contributions in the advancement of technology and business networks are delivering many impactful outcomes for clients.
We organize all of the trending information in your field so you don't have to. Join 102,000+ users and stay up to date on the latest articles your peers are reading.
You know about us, now we want to get to know you!
Let's personalize your content
Let's get even more personalized
We recognize your account from another site in our network, please click 'Send Email' below to continue with verifying your account and setting a password.


Let's personalize your content