This site uses cookies to improve your experience. To help us insure we adhere to various privacy regulations, please select your country/region of residence. If you do not select a country, we will assume you are from the United States. Select your Cookie Settings or view our Privacy Policy and Terms of Use.
Cookie Settings
Cookies and similar technologies are used on this website for proper function of the website, for tracking performance analytics and for marketing purposes. We and some of our third-party providers may use cookie data for various purposes. Please review the cookie settings below and choose your preference.
Used for the proper function of the website
Used for monitoring website traffic and interactions
Cookie Settings
Cookies and similar technologies are used on this website for proper function of the website, for tracking performance analytics and for marketing purposes. We and some of our third-party providers may use cookie data for various purposes. Please review the cookie settings below and choose your preference.
Strictly Necessary: Used for the proper function of the website
Performance/Analytics: Used for monitoring website traffic and interactions
At each company, there is a relationship between the metrics of growth, margin, inventory, customer service, and asset strategy. For the purpose of this article, I will use Return on Invested Capital (ROIC) as the proxy metric to discuss asset utilization.) Supply chain excellence was largely defined as manufacturing excellence.
While the performance rankings were based on comparisons of inventory turns, operating margin and Return on Invested Capital (ROIC) for the periods of 2006-2013 and 2009-2013, the concept is that to be a supply chain leader you must outperform and drive improvement. Aligned Metrics. We find that this is true of too few companies.
Over the period of 2009-2015 only 88% of companies made improvement on the “Supply Chain Metrics That Matter.” (The The Supply Chain Metrics That Matter are a portfolio of metrics which correlate to higher market capitalization. Comparison of Performance and Improvement of Companies in the Chemical Industry for 2009-2015.
One of my favorite interviews on this topic, that I recently completed for my upcoming book Metrics That Matter , was with Amway’s Chief Supply Chain Officer George Calvert. We produce there because the regulations say that you need to manufacture there to sell there. Service level is our most important metric.
2009: H1N1 Outbreak in Mexico. However, the logic Cisco uses to manage the disruption is very robust and details are summarized into the infographic below, Note: metrics data is for illustrative purpose. Metrics look very simple and its kind of nice to have something like these. And according to the U.S. 2011: Thailand Floods.
In our work on the Supply Chains to Admire report , we tracked the progress of manufacturing, retailing and distribution companies for the period of 2006 to 2013 and 2009-2013. We then rated companies on their ability to manage and improve a portfolio of metrics: operating margin, inventory turns and Return on Invested Capital (ROIC).
When you run the graphs, there is marked difference for these companies that begins to appear in 2009. To minimize costs, supply chain teams of manufacturing leaders have designed the value network to absorb this volatility. By focusing so strongly on manufacturing, they have thrown the supply chain out of balance.
Shipping approximately 400 million selling units consisting of 700 million manufactured units per year, Carter’s employs about 4,000 employees at its peak. Over the period of 2009-2015, only 88% of companies made improvement on the Supply Chain Metrics That Matter. (As Performance on the Supply Chain Metrics That Matter.
The average manufacturing company’s supply chain organization is 15 years old. The supply chain is a complex system with finite, and non-linear relationships between supply chain metrics that drive balance sheet results. We find that companies can improve one, but not two of the metrics. A Look at History. Resiliency.
We are trying to understand how supply chain leaders have raised the bar at the intersection of these four sets of metrics on the supply chain effective frontier. I also believe that it is because the organization is not incented to manage cash-to-cash metrics. The results have been eye-opening.
These examples point to a key metric that’s emerging for quantifying the value of social networking : Time-to-Resolution. Back in April 2009, only about 25 percent of 50-64 year olds were using social networking technologies, compared to about 78 percent of 18-29 year olds.
We have found that supply chain metrics are gnarly and complicated.During In our program, cost avoidance, while desirable, does not count towards the metric. Our approach simply breaks accountabilities and goals across the areas of Manufacturing, Logistics/Network Optimization and Ingredients/Packaging. What have you learned?
It is data driven research: a deep analysis of performance, improvement and Price to Tangible Book Value of 320 companies across 31 industries for the period of 2009-2015. Check out their performance by plotting year-over-year metrics at the intersection of two ratios and look at the patterns. We hope to see you there!
Over the period of 2009-2015, only 88% of companies made improvement on the Supply Chain Metrics That Matter. Companies passing these two tests are then analyzed against the performance factors for 2009-2015: Growth. The North American operation is the top manufacturer in the US cordless market. Operating Margin.
The selection of metrics is based on prior work with Arizona State University to understand which metrics, in combination, correlate to market capitalization and price to book value. Northrup Grumman, PACCAR Inc, ResMed, Ross Stores, Sleep Number, Subaru, Toro, and Taiwan Semiconductor Manufacturing (TSMC) Company.
The traditional manufacturing job defined the middle class. Each time, I turn on the channel, manufacturing jobs frame the global debate. Ironically, as global manufacturing jobs decrease, there is a need for talent for the global supply chain. However, globalization comes with responsibility.
In the selection of time frames to analyze, we look at the long-term view including the recessionary period of 2006-2009, the post recessionary period of 2009-2014 and the more recent time period of 2011-2014. Overall Results on the Supply Chain Metrics That Matter. Supply chain leaders make progress in three-to-five years.
In 2009, the United States boosted import duties on Chinese tires from 4% to 35%, and did so with only 15 days’ notice. When Cisco saw news of wildfires in Colorado in 2012, it wasn’t concerned, because it had no manufacturing or suppliers in the area. But even watchful companies can still miss the potential impact of a disruption.
Simply defined, reverse logistics generally refers to the process of managing the flow of goods, products, or materials from the customer back to the seller or manufacturer. Manufacturers may recall stock because of flaws or to replace older products with newer ones. Reasons why reverse logistics are necessary can be diverse.
49% of respondents were from the manufacturing industry, 16% from the mechanical engineering sector, and 11% from the automotive market. As some component lead times push into 2023, the shortage is expected to last 24 months before it recedes – similar to the chip shortage of 2008-2009. Consultancy UK). Source: Consultancy.UK.
It is data driven research: a deep analysis of performance, improvement and Price to Tangible Book Value of 320 companies across 31 industries for the period of 2009-2015. Check out their performance by plotting year-over-year metrics at the intersection of two ratios and look at the patterns. We hope to see you there!
For December 2015, retail sales were the lowest since 2009. Manufacturers are Now Selling Directly to Consumers. Retailers can no longer have their heads in the sand, but neither can consumer products manufacturers. Note that apparel manufacturing is growing and apparel retail is declining. What does this mean?
Performance and Improvement within the Pharmaceutical Industry for 2009-2015. Given the level of industry maturity within pharmaceutical manufacturing, Novo Nordisk has a strong foundation in manufacturing. We also have strong manufacturing culture and high focus on “Lean” initiatives. This is a design element.
Mariotti states that you first have to measure it, and he outlines several metrics and techniques in the book, including ranking customers by annual sales, profit, and gross margin percentage. How do you reduce supply chain complexity, or at least slow its growth?
In the process of compiling the Supply Chains to Admire report for last year’s Supply Chain Insights Global Summit , the research team at Supply Chain Insights calculated the rate of supply chain improvement of companies by industry for the period of 2006-2013 and 2009-2013. We studied this pre and post-recession. Here I share their story.
Tuesday, July 07, 2009. and $745 million internationally with first-tier diverse suppliers In 2008, IBM’s PELM operations worldwide processed 42,302 metric tons of end-of-life products and product waste. Manufacturing Central. Still not excited, well visit often and eventually you will be. Subscribe To. SCM Lowdown.
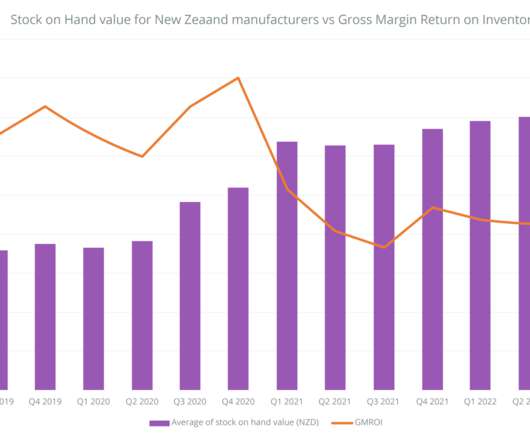
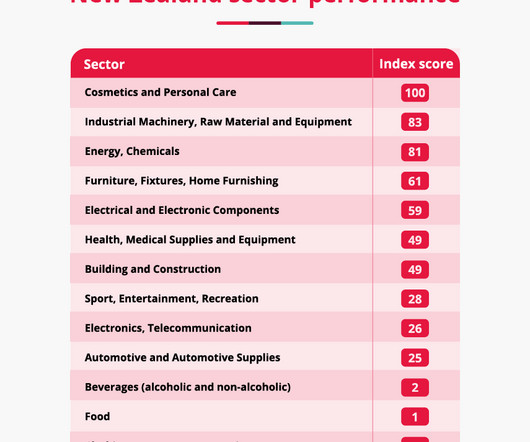
New manufacturing data has revealed which industries and nations are leading the way in the post-pandemic economic recovery – and the tactics they’re using to beat supply chain disruption. We did this by analysing four key metrics: The average value of total stock on hand – reflecting the volume of goods held (plus impacts from inflation).
New manufacturing data reveals the small to medium manufacturing sector remains in recovery mode, with global performance largely mapping to local economic conditions. New Zealand manufacturing, meanwhile, is at an historic inflection point, with stagnant performance in multiple sectors.
But to make their strongest case, SCRM advocates need to focus on one key metric: return on investment. Collaborate with stakeholders in finance, sales, manufacturing, etc., The unprecedented supply chain disruptions caused by COVID-19 provide potent arguments for supply chain pros seeking greater support of SCRM from C-level leaders.
What the last recession taught us An article from McKinsey & Company (2022) analyzed the performance of about 40 publicly traded distribution companies during the 2007-2009 recession. The post Winning strategies for distributors and manufacturers during an economic downturn appeared first on.
He led the team during the period of 2007-2009. They will be featured in our digital showcase and are a part of the Jabil story on digital manufacturing. Lora has written the books Supply Chain Metrics That Matter and Bricks Matter , and is currently working on her third book, Leadership Matters.
In process manufacturing BASF, L’Oréal and The Clorox Company. In discrete manufacturing those are Apple, Cisco, Coopertires, Cummins, Edwards, Steelcase and Tsmc. Similarly, industries like beverages, contract manufacturing, food, oil and gas, restaurants and fast food, and retail apparel have finalists, but no winners.
the “inventory to sales” ratio (inventory levels divided by a month’s worth of sales) spiked in late 2008/early 2009 as the recession caught companies with way more inventory than needed versus suddenly shrinking demand. As seen in the chart below from the Commerce Dept., Read Full Article. Source: EBN. Read Full Article.
Industrial Manufacturing. In this blog I will focus on first couple of sub process of demand planning cycle - 1) Setting up demand planning objectives and metrics for different business units/customers/key items/locations 2) Setting up the frequency of the forecasting process (create/review/publish) with the time horizons. Automotive.
Industrial Manufacturing. Insuring that each function, including online marketing, store operations and supply chain have common objectives, metrics and aligned rewards for the coming year. December 2009. November 2009. October 2009. September 2009. August 2009. April 2009. March 2009.
Industrial Manufacturing. Example: For a shipper, number of shipments at a 3PL warehouse might be a relevant metric while the 3PL provider may be more interested in the number of shipments for all serviced shippers. December 2009. November 2009. October 2009. September 2009. August 2009. April 2009.
Stuart William was in one of my former MBA classes at NC State in 2008, and graduated into one of the worst economies ever in May of 2009. The are a regional make to order kitchen cabinet manufacturer, and have two primary sales channels of modular kitchen and bathroom cabinets. They have 5 MFC retail outlets, and a dealer network.
Industrial Manufacturing. Consistent Business Intelligence - BI metrics can be obtained consistently across the entire business banking on the foundation of single version of master data. December 2009. November 2009. October 2009. September 2009. August 2009. April 2009. March 2009.
Manufacturers may recall stock because of flaws or to replace older products with newer ones. In a manufacturing plant, reverse logistics performance is tied to the money or materials that can be recovered cost-effectively from the returned product. Reasons why reverse logistics are necessary can be diverse.
Industrial Manufacturing. IT enablement in areas like Mobile work management, Health and Safety, Metrics monitoring (KPI) etc. December 2009. November 2009. October 2009. September 2009. August 2009. April 2009. March 2009. February 2009. January 2009. Automotive.
Founded in 2009, Forerunner Ventures specializes in investing in commerce-related businesses including Warby Parker, Away, Jet, Hims, Hers, Glossier, Bonobos, and others. Some brands have a structural advantage to how they manufacture or an innovative way to how they distribute (e.g., Its latest fund (made in 2018) was $250 million.
Industrial Manufacturing. In this step, the actuals are compared with the planned metrics (MAPE, forecast accuracy, bias etc.) December 2009. November 2009. October 2009. September 2009. August 2009. April 2009. March 2009. February 2009. January 2009. Automotive.
Industrial Manufacturing. Some of those are Cognos, iLog, SPSS, Core Metrics, Emptoris, Vivisimo and many others, as world is moving from reactive to proactive. December 2009. November 2009. October 2009. September 2009. August 2009. April 2009. March 2009. February 2009.
Industrial Manufacturing. As our main focus was towards asset intensive organizations, we looked more into Oil & Gas, Utilities and Manufacturing and Transportation industries. A further benefit of integration of these many systems is to allow organizations to effectively report on their sustainability metrics. October 2009.
We organize all of the trending information in your field so you don't have to. Join 102,000+ users and stay up to date on the latest articles your peers are reading.
You know about us, now we want to get to know you!
Let's personalize your content
Let's get even more personalized
We recognize your account from another site in our network, please click 'Send Email' below to continue with verifying your account and setting a password.


Let's personalize your content