This site uses cookies to improve your experience. To help us insure we adhere to various privacy regulations, please select your country/region of residence. If you do not select a country, we will assume you are from the United States. Select your Cookie Settings or view our Privacy Policy and Terms of Use.
Cookie Settings
Cookies and similar technologies are used on this website for proper function of the website, for tracking performance analytics and for marketing purposes. We and some of our third-party providers may use cookie data for various purposes. Please review the cookie settings below and choose your preference.
Used for the proper function of the website
Used for monitoring website traffic and interactions
Cookie Settings
Cookies and similar technologies are used on this website for proper function of the website, for tracking performance analytics and for marketing purposes. We and some of our third-party providers may use cookie data for various purposes. Please review the cookie settings below and choose your preference.
Strictly Necessary: Used for the proper function of the website
Performance/Analytics: Used for monitoring website traffic and interactions
That was our vision, even starting back in 2010. Solvoyo has a metric they call the user acceptance rate. This metric measures the percentage of time the planners accept replenishment, transportation, or inventory plans as they are without any change in the timing of the delivery or the quantity to be delivered.
In follow-up qualitative interviews, one of the largest issues with organizational alignment was metric definition and a clear definition of supply chain excellence. In my post Mea Culpa, I reference my work with the Gartner Supply Chain Hierarchy of Metrics. Error is error, but is it the most important metric? My answer is no.
Granular data by volume is a must to be able to manage replenishment, network design, and inventory targets. The budget is for a fiscal year with quarter reporting and updates. The direct connection between the two processes increases costs and increases error. Most budgets are completed in currency at a brand level.
For the past five years, the team at Supply Chain Insights identified Supply Chains to Admire Award Winners by analyzing performance by peer group on the key metrics of growth, operating margin, inventory turns and Return on Invested Capital (ROIC). Diversified Industry Performance For the Period of 2010-2017.
The period of 2000-2010 was turbulent for these best-of-breed APS technologies. The implementations were longer, the purchasecosts were higher, and the functionality was less robust and lacking flexibility. All of the results are reported in aggregate. All of the responses are reported in aggregate.
Gartner purchased the firm in 2010.) My desire was to make the rankings of the Top 25 supply chain report data-driven based on balance sheet results. Companies entered the pandemic with twenty more days of inventory than at the beginning of the great recession. AMR Research was an industry analyst firm in Boston.
For the past five years, the team at Supply Chain Insights identified Supply Chains to Admire Award Winners by analyzing performance by peer group on the key metrics of growth, operating margin, inventory turns and Return on Invested Capital (ROIC). Diversified Industry Performance For the Period of 2010-2017.
Completed in 2012, the ERP project forced the company to standardize organizational design, roles, and metrics. In 2010-2011 Shell partnered with Terra Technology to roll-out demand sensing as a bolt-on to the SAP environment. They saw a steady drop in inventory and reduced working capital by about 50% over the period of 2011-2015.
Today, over 90% of companies have deployed ERP and APS, but as shown in Table 1, inventory levels have grown not decreased in over 80% of industries studied. And, while inventories in automotive have decreased slightly, this progress is primarily due to the shifting of inventory back to suppliers versus overall value chain improvement.
On Monday, November 27th, Logility announced the purchase of privately-held Halo Business Intelligence. Optiant, inventory optimization, 2010, $3.3M Today Logility analytics–user interface, dashboard, and query–is proprietary and lacking the more intuitive features of visual analytics software competitors.
In the period of 2005-2010 I created research on the topic of demand-driven value networks as an analyst at AMR Research. This ended when Gartner purchased AMR Research in 2010. Since I do not believe in the Gartner business model, I left. 2) Build an outside-in demand planning model to use channel data.
It evolved from material requirements planning (MRP) and later manufacturing resource planning (MRP II), which were already being used in manufacturing industries to manage production and inventory. In 2010, it acquired Sybase, gaining database and mobile technologies that contributed to the development of SAP HANA, its in-memory database.
Instead of setting up brick-and-mortar stores, or keeping inventory on hand, you can start offering this new product on your new store. A recent report by Frost & Sullivan, “The Future of Parts and Service Retailing in the Automotive Aftermarket” , predicts that by 2025, 10 to 15 percent of all global parts sales will be made online.
Based on recent reports, it appears that, three years later, the answer to that question remains the same: We don’t know. Compliance with a similar law passed in California back in 2010 is equally poor. Consumers, communities and businesses deserve better.”.
Original version published in APICS Extra , July 2010. Supply chain executives were under pressure to develop more efficient, customer-centric supply chains while finding innovative ways to reduce costs and enable growth. Companies tripped over themselves to build ecommerce portals, and one-click purchasing grew in relevance.
Its become almost an annual ritual, similar to the Fortune 500, the top billionaires and the AMR Top 25 Supply Chain report. This article in MarineLog reported that "Toyota had to rent a boat in Sweden to store 2,500 extra cars from inventory.". But overall I tip my hat to AMR and look forward to the next top 25 in 2010.
Walmart would not have the ability to provide such low prices and have consistent inventory in the over 5,000 stores in the United States and over 1.3 “The net true cost considers issues such as waste-to-landfill, greenhouse gas emissions, economic mobility, worker safety and food safety. ” Walmart states early on.
The Vice President Supply and Inventory Management Europe/Asia was chosen as Supply Chain Professional of the Year 2014 on Wednesday 4 June 2014, narrowly beating Marcel van Rossum from Johnson & Johnson and Bart van Schaik from Arla Foods. Jeroen van Weesep, Vice President Supply and Inventory Management Europe/Asia, Lego. .
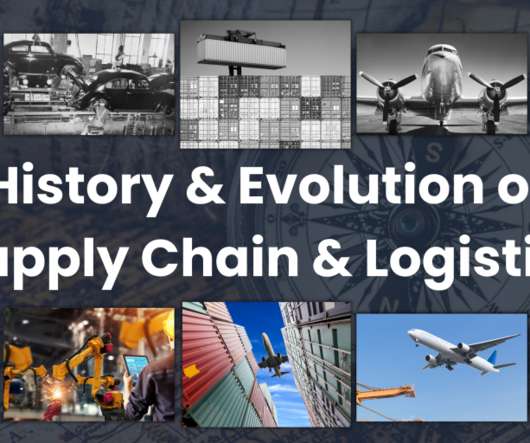
Also, traditional logistics focuses its attention on activities such as procurement , distribution, maintenance, and inventory management. The Seventh: Supply Chain Digitalization (2010’s). NAPM published a new magazine, Purchasing Magazine, in 1965. The Fifth: Business Logistics (1990s). Neil Southern, 2011).
SCM also deals with the movement and storing of materials needed to create a product, as well as inventory management, and keeping track of finished goods from where they were created to who they go to. The other areas that SCM is related to are operations, logistics, procurement, and information technology. Forward Momentum.
Luxottica maintains a warehouse in Atlanta and ships roughly 470k units of inventory each week - 300k to retail locations and 170k as wholesale to independent opticians and department stores. If purchasing glasses online, consumers are able to choose any five frames online to be delivered as part of their Home-Try-On (HTO) program.
In transportation news, the American Trucking Associations reported that its advanced seasonally adjusted For-Hire Truck Tonnage Index declined 0.9% Looking ahead, Costello is concerned “about the high level of inventories throughout the supply chain [that] could have a negative impact on truck freight volumes over the next few months.”.
Supply chain collaboration is a hot topic today and no wonder: companies that collaborate effectively across the supply chain have enjoyed dramatic reductions in inventories and costs, together with improvements in speed, service levels, and customer satisfaction. Blog post and permission to publish provided by Milan Vyas.
” These CIOs are more aligned with identifying “one throat to choke” and often they have bought into the theory that supply chain solutions from their ERP provider are robust and well integrated based on the latest technology industry analyst report. All of the results are reported in aggregate. I did not see it.
It has been forecasted that by 2040, approximately 95% of all purchases will be facilitated by ecommerce. From 2010-2016, venture capital funds invested in over 2000 early stage deals in the ‘internet’ sector. Product sourcing is the process of purchasing or creating products that you can sell. Product sourcing.
Since 2010, online shopping has been steadily increasing. From 2010 to 2020, e-commerce sales grew from 4.2% From 2010 to 2020, e-commerce sales grew from 4.2% To do this, data and processes need to be integrated across the network, resulting in additional IT investments, operational work, and shipping and handling costs.
” These CIOs are more aligned with identifying “one throat to choke” and often they have bought into the theory that supply chain solutions from their ERP provider are robust and well integrated based on the latest technology industry analyst report. All of the results are reported in aggregate. I did not see it.
” He noted that “My passion is Process Analytics: taking business datasets and using my technical background in engineering. I love data and analytics that create insights into processes and approaches.” Our 2010 supply chain was less than optimal. We have 7000 employees and are growing into a$10B company.
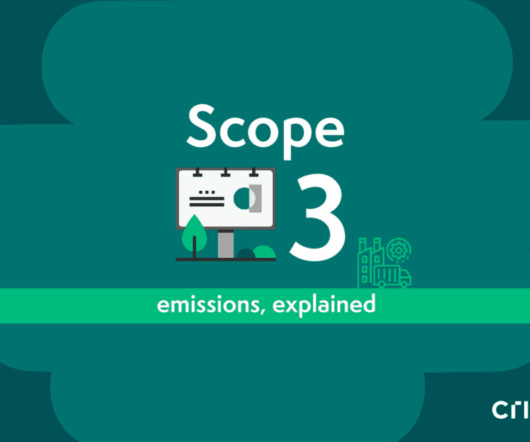
The article demystifies the complexities of scope 3 emissions reporting, offering key tips to stay ahead of regulatory changes and satisfy stakeholder demands. In 2010, the U.S. Until recently, reporting scope 3 emissions – which include indirect sources that organizations contribute to – has been optional.
In the last three years we’ve developed our strategy, centralised procurement, purchasing and manufacturing aligned our portfolios across all categories globally and developed our exclusive brands portfolio. there are three options: to set to work with excel, to develop one’s own solution or to purchase an off-the-shelf tool.
So the CSR score too is more of a popularity contest than a consistent metric. The slideshow that follows, then, is our coverage of Gartner’s rankings, which includes both comments from Gartner’s analysts as well as our own analysis, based on independent reporting. Media Type. Media Credit. Privacy Settings. anonymous user.
E-commerce drives growth in warehouses & DCs According to Walker Sands’ The Future of Retail 2019: The Paradox Between Convenience and Connection , consumers are increasingly comfortable shopping online, with 46% saying they’re more open to purchasing big-ticket items such as a car or grill online than they were a year ago. In the U.S.,
Sourcing & Procurement. Sourcing & Procurement. ProcureEdge – Sourcing & Procurement. cities with these lockers in-place are located in states that already collect sales taxes for online purchases. Business Process Outsourcing. Customer Service. Finance & Accounting. Human Resources. Banking Suite.
Luxottica maintains a warehouse in Atlanta and ships roughly 470k units of inventory each week - 300k to retail locations and 170k as wholesale to independent opticians and department stores. If purchasing glasses online, consumers are able to choose any five frames online to be delivered as part of their Home-Try-On (HTO) program.
Today, as the founder and managing partner of USM Supply Chain Consultants she has put her expertise in supply chain, procurement, finance and project management to work to help her clients achieve greater profitability. In the end-to-end supply chain there’s procurement, logistics, operations, and warehousing.
Many metrics can be used to determine the top 3PL warehousing companies, such as company revenue, the number of warehouses, total warehouse square footage , etc. This compilation is based on the most currently available company revenue data (between 2018 and 2020) without factoring in any other metric. Møller Mærsk Group.
Yet there’s a proactive approach that addresses the high cost of healthcare: value-based purchasing (VBP). VBP also improves patient satisfaction by fostering greater collaboration among healthcare providers and making the patient experience one of the key evaluation metrics for hospitals.
According to Statista data, 64% of consumers worldwide regularly made purchases directly from brands in 2022. Customer relationship: D2C companies have direct access to customer feedback, preferences, and purchasing behaviour. Decision making: D2C companies have access to detailed data and analytics.
Food away from home” overtook “food at home” for the first time around 2010, as illustrated in the chart below. This service offers competitive wholesale pricing, opportunities to purchase items by the case or unit and seven-day-a-week delivery.” Source: Data from USDA Economic Research Service Food Expenditure Series.
Sourcing & Procurement. Sourcing & Procurement. ProcureEdge – Sourcing & Procurement. During peak processing periods - like year closing activities, balance sheet preparation, inventory reconciliation etc. Typically, organizations have a very high lead time for procuring hardware and setting up networks.
After finishing the Supply Chains to Admire report and the Youtube series (to be released this week), this is my feeling. In the review of my first book, Bricks Matter , Keith Harrison, former Global Director of Product Supply at P&G asked me, “You mention the need for supply chains to shift from a focus on cost to value.
The total cost of this recall is believed to have exceeded $1 billion after lawsuits. In 2018, unsanitary conditions at Rose Acre Farms prompted the recall of over 200-million eggs from 17 facilities , the largest of its kind since 2010. Calculating the Cost of a Food Recall. Based on published reports. Sunland, Inc.
Inventory management is a critical function of any business, with drastic implications on profit margins. Stock the right goods at the right levels and you can reduce carrying costs, mitigate the risk of shrinkage and still please customers. Let’s take a closer look at this important metric. What is inventory turnover?
At Wenzel we watch the PMI ( Purchasing Managers Index ) and the USMTO (United States Manufacturing Technology Orders) numbers and compare them with our own performance. The Purchasing Managers' Index (PMI) is an indicator of the economic health of the manufacturing sector. So not good news on the whole.
We organize all of the trending information in your field so you don't have to. Join 102,000+ users and stay up to date on the latest articles your peers are reading.
You know about us, now we want to get to know you!
Let's personalize your content
Let's get even more personalized
We recognize your account from another site in our network, please click 'Send Email' below to continue with verifying your account and setting a password.


Let's personalize your content