article thumbnail

Supply Chain Leaders Rearranging Deck Chairs? Yes, I Think So.

Supply Chain Shaman

The supply chain is complex non-linear system that is easily thrown out of balance through a focus on functional metrics. They rock back and forth in improving singular metrics but struggle to improve a portfolio of growth, margin, inventory performance, and asset utilization. Comparing 2010-2019. Change metrics systems.

article thumbnail

Trying to Push Content Above the Noise

Supply Chain Shaman

The month of December was my longest writing respite since I started this blog in January 2010. We talk about the move from functional metrics to a balanced scorecard, but we don’t use a balanced scorecard as an objective function. Today is a writing day. My last post was December 7th, 2023.

Gartner 275
Insiders

Sign Up for our Newsletter

This site is protected by reCAPTCHA and the Google Privacy Policy and Terms of Service apply.

article thumbnail

Good-bye. I Will Go Forward by Going Forward.

Supply Chain Shaman

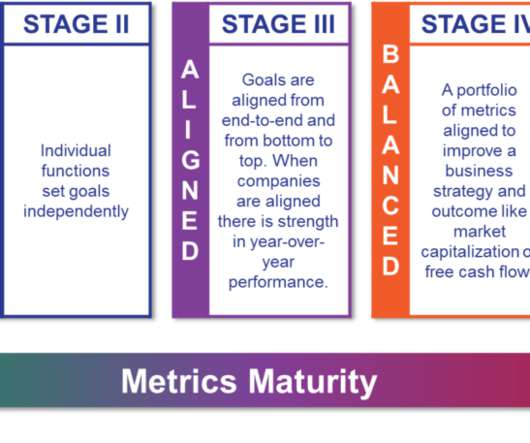
I worked with Roddy when I was at AMR Research from 2006 to 2010. As a strong proponent of maturity models, many discussions centered on the movement from program-based to functional metrics and how to drive alignment. Our discussions, influenced the model shown in Figure 1 from the Book Metrics that Matter. Roddy loved beer.

Modeling 195
article thumbnail

Who Should Be In The Winner’s Circle?

Supply Chain Shaman

Heavily booked and running from meeting to meeting, I was late. The topic of the meeting was the logistics to launch of the AMR Research Top 25. As a research leader at AMR Research when I voiced the concern for a more rigorous peer group analysis in prior meetings, I hoped for a better outcome. The result?

Gartner 235
article thumbnail

Looking Beyond Red Arrows

Supply Chain Shaman

It is hard work to maintain the status quo in metrics performance. A balanced portfolio of metrics delivers the greatest value. Companies balance supply chain metrics better in good times than bad. Reader’s note, the way to reach this chart is to first identify the average value for the metric for the period of 2010-2016.

article thumbnail

A New Decade: Give Science A Chance

Supply Chain Shaman

Orbit Chart for Henkel versus Consumer Non-Durable Industry for the Period of 2010-2019. Meeting the market needs of COVID-19 caused organizations to rally, work together, and build a better supply chain through brute force. Use data and new metrics systems to free the organization from the ball and chain of corporate politics.

article thumbnail

2020 Requires Big Wings and Feet

Supply Chain Shaman

Financial forecasts tend to have a negative bias (forecasts less than market potential) to ensure that employees have a better probability of meeting their bonuses. No metric should be measured in isolation, and functional metrics should be replaced with the balanced scorecard metrics shown in Figure 2. Bias and error.