Remove 2010 Remove Metrics Remove Procurement
article thumbnail

A New Decade: Give Science A Chance

Supply Chain Shaman

Orbit Chart for Henkel versus Consumer Non-Durable Industry for the Period of 2010-2019. In short, his vision of an end-to-end supply chain was transactional: better processing of order-to-cash and procure-to-pay. Use data and new metrics systems to free the organization from the ball and chain of corporate politics.

article thumbnail

What is Purchase Price Variance (PPV) and How to Calculate it?

SCMDOJO

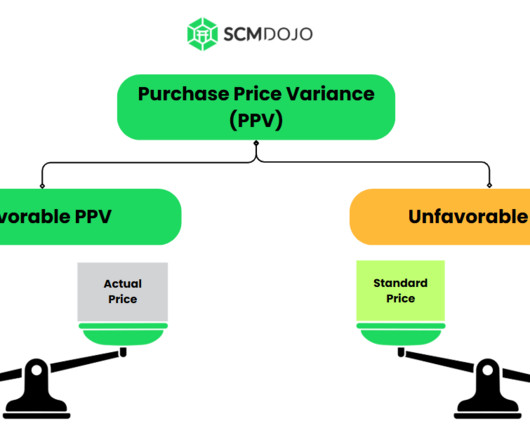
Introduction Gardner, (1954) and Huntzinger, (2007) define Purchase price variance (PPV) as a metric used to measure the effectiveness of cost-saving efforts by calculating the difference between the planned cost (standard pricing) allocated for purchasing activities and the actual cost incurred.

Insiders

Sign Up for our Newsletter

This site is protected by reCAPTCHA and the Google Privacy Policy and Terms of Service apply.

article thumbnail

2020 Requires Big Wings and Feet

Supply Chain Shaman

No metric should be measured in isolation, and functional metrics should be replaced with the balanced scorecard metrics shown in Figure 2. To maximize value—price to tangible book, functional metrics need to be reset to focus on reliability. Average Inventory Levels by Industry over the Period of 2010-2018.

article thumbnail

Rockwell Automation: Supply Chains to Admire Winner

Supply Chain Shaman

For the past five years, the team at Supply Chain Insights identified Supply Chains to Admire Award Winners by analyzing performance by peer group on the key metrics of growth, operating margin, inventory turns and Return on Invested Capital (ROIC). To decide winners, we analyze post-recession period performance of 2010-2018 by peer group.

article thumbnail

Rockwell Automation: A Case Study in Supply Chain Excellence

Supply Chain Shaman

For the past five years, the team at Supply Chain Insights identified Supply Chains to Admire Award Winners by analyzing performance by peer group on the key metrics of growth, operating margin, inventory turns and Return on Invested Capital (ROIC). To decide winners, we analyze post-recession period performance of 2010-2018 by peer group.

article thumbnail

Getting Ready for 2017: Reflections on Telling Lies

Supply Chain Shaman

As I study research methods, and the market, I realize the lies I’ve spun for prior employers (Gartner and AMR Research) are untrue: The AMR Research Hierarchy of Supply Chain Metrics. This research, released in 2005, gives a compelling view of a metrics hierarchy. Bimodal Supply Chains Are a Viable Strategy. Reflections.

article thumbnail

Insights from Elemica reveal 2014 Frankfurt

Talking Logistics

The German team overcame disappointments in 2006 and 2010 to win the World Cup this year, while favorites Spain (the defending champion) and Brazil (the host country) were humbled by the competition. That was my opening question to the executives attending last month’s Elemica reveal 2014 Conference in Frankfurt.