This site uses cookies to improve your experience. To help us insure we adhere to various privacy regulations, please select your country/region of residence. If you do not select a country, we will assume you are from the United States. Select your Cookie Settings or view our Privacy Policy and Terms of Use.
Cookie Settings
Cookies and similar technologies are used on this website for proper function of the website, for tracking performance analytics and for marketing purposes. We and some of our third-party providers may use cookie data for various purposes. Please review the cookie settings below and choose your preference.
Used for the proper function of the website
Used for monitoring website traffic and interactions
Cookie Settings
Cookies and similar technologies are used on this website for proper function of the website, for tracking performance analytics and for marketing purposes. We and some of our third-party providers may use cookie data for various purposes. Please review the cookie settings below and choose your preference.
Strictly Necessary: Used for the proper function of the website
Performance/Analytics: Used for monitoring website traffic and interactions
Over the last month, I have been working on the 2019 Supply Chains to Admire analysis. The source data for the analysis comes from Ycharts.). We selected these metrics based on correlation work with Arizona State University in 2012. Please join me in congratulating the winners of the Supply Chains to Admire for 2019.
Note that in 2019, that the gaps changed doubled between manufacturing and procurement teams (increasing to 39%) and operations and finance teams (increasing to 40%) and grew slightly between sales and operations teams (increasing to 48%). Organizational Alignment in 2019. Functional Metrics. Organizational Alignment 2012.
Do Set Clear KPIs and Governance Structures : Establish transparent metrics for sales, coverage, and service levels. Do Invest in Distributor Capability Building : Provide training, digital tools, and performance incentives. A well-equipped distributor is an extension of your brand and a key to market penetration.
At each company, there is a relationship between the metrics of growth, margin, inventory, customer service, and asset strategy. For the purpose of this article, I will use Return on Invested Capital (ROIC) as the proxy metric to discuss asset utilization.) Yannis transitioned from the role after eight years in 2019.
The use of orbit charts allowed me to see the patterns of performance at the intersection of metrics over time. This data source synchronizes corporate reporting across global markets while tracking restatements, name changes, and currency shifts.) By charting the performance against peer groups, I could see the story. The secret?
Despite goals to improve agility and resiliency, functional metrics for manufacturing efficiency continually throw the supply chain out of balance. The analysis covers the period from 2010 to 2019. The second step is to align metrics to the strategy. A focus on cross-functional metrics improves supply chain resiliency. (I
The vehicle deployments are expected to lower emissions by 7,052 metric tons of greenhouse gas (GHG) emissions annually, equivalent to 1,533 passenger cars removed from the road. The order is one of the largest of its kind, representing 8% of the total 3,800 electric trucks that Volvo has delivered since 2019. by the end of 2023.
On the one hand, we should celebrate the fact that the aggregate industry moved 38% more freight in 2021 when compared to 2019. Over the past decade payments to transportation carriers from shippers increased from net 30 to net 60 moving to net 90 in 2019. Build Strong Supply Chain Sourcing Development Practices. ” [link].
Source: Google. This was not a trivial transition because the software industry, until relatively recently, was long fixated on measuring its health and success by new license revenue (sales of products) instead of customer-centric metrics, such as realization of ROI and payback objectives. Takeaways from Evolution 2019.
As product flows rapidly shifted and hard baked assumptions about lead times and sourcing locations were put to test, users across many organizations bypassed their planning systems and turned to excel sheets, internal data science teams or non-traditional supply chain vendors who could deliver AI based solutions at a faster turn.
Bottom Line: The top 10 manufacturing trends reflect how manufacturers are planning to achieve their goals of revenue growth, operational improvements, digital transformation, and launching new products and services in 2019. A copy of the survey results are downloadable here (PDF, free, opt-in).
Now Gartner reports that SCP BPO is gaining traction ( Market Guide for Supply Chain Planning BPO or BPaaS, 29 July 2019 ), particularly in North America and Europe. Companies moving to BPO in these practice areas are experiencing supply chain improvements in metrics such as inventory turnover and customer service. versus $4.84
However, rates can be a noisy metric, as fluctuations in haul lengths and inflationary cost inputs can distort the picture. The pandemic surge came after a deep freight recession in 2019. In weaker markets, carriers are generally more willing to accept freight, so rising rejection rates in a down market carry more weight.
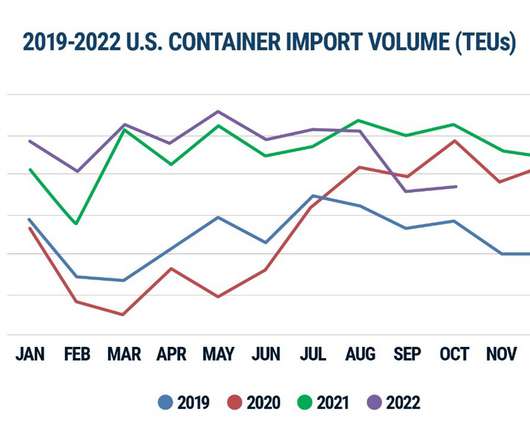
There were record numbers (see Figure 1) through August 2022 and even when September’s volumes receded they were still 7% higher than pre-pandemic 2019. Source: Descartes Datamyne. Despite many calling for U.S. import volumes to plummet well before summer, they didn’t. Figure 1: U.S. Container Import Volume Year-over-Year Comparison.
28% of global retailers have tried to find alternative sourcing options due to supply chain issues (RetailNext, 2020). Source: Consultancy.UK. Image source: Fortune. Within a week of Russian troops crossing into Ukraine, the benchmark for thermal coal prices reached a record high of $446 per metric ton. Consultancy UK).
According to 2019 Definitive Healthcare data, U.S. Quite often there can be a general lack of spend and vendor management and strategic sourcing activities. Ultimately, BSW was able to improve a key metric (Supply Expense as a % of Net Patient Revenue) and generate millions in savings. Share on Twitter. Big Opportunity Ahead.
metric tons per person and in the European Union 5.66 metric tons per person. metric tons. In 2019, the Least Developed Countries (LDCs) accounted for just 1.1% Lets now break that down into the various stages in the traditional upstream source-to-contract (S2C) processes.
294 manufacturing facilities produced more than 90 million metric tons of food and beverage in 2021. Scope 1 emissions include direct emissions from the company’s owned and controlled sources. Supplier relationships need to move from transactional deals to true sourcing partnerships with their most important suppliers.
”[2] The staff at Advanced Transportation Systems (ATS) adds, “Supply chain management deals with the procedures encompassing sourcing components a company requires to develop its products or service to deliver the end product to customers. ” 6 Rivers Systems Blog, 24 June 2019. [3] Delivering. Footnotes. [1]
On the one hand, we should celebrate the fact that the aggregate industry moved 38% more freight in 2021 when compared to 2019. Over the past decade payments to transportation carriers from shippers increased from net 30 to net 60 moving to net 90 in 2019. Build Strong Supply Chain Sourcing Development Practices. ” [link].
On the one hand, we should celebrate the fact that the aggregate industry moved 38% more freight in 2021 when compared to 2019. Over the past decade payments to transportation carriers from shippers increased from net 30 to net 60 moving to net 90 in 2019. Build Strong Supply Chain Sourcing Development Practices. ” [link].
Mr. Roszko was appointed EVP Global Sales in February 2019 and appointed Chief Commercial Officer in June 2022. Andrew Roszko, Descartes’ Chief Commercial Officer, will depart the company in Q2FY26 to pursue another opportunity. Andrew has been a valuable contributor to Descartes’ commercial development.
Orchestration enables companies to effectively manage trade-offs between source, make, deliver and sell.) Organizations can align to drive value despite the allegiance to functional metrics. We source this data from Y charts. As long as companies are motivated by functional metrics, inventory management will be an enigma.
Now Gartner reports that SCP BPO is gaining traction ( Market Guide for Supply Chain Planning BPO or BPaaS, 29 July 2019 ), particularly in North America and Europe. Companies moving to BPO in these practice areas are experiencing supply chain improvements in metrics such as inventory turnover and customer service. versus $4.84
In 2019, Will Beery was appointed the vice president and tasked with leading the company’s global digital supply chain transformation. What a Supply Chain Digital Transformation Means Unsurprisingly, a company as large as Mars has a highly complex supply chain involving global sourcing, manufacturing, and distribution.
In fact, IT spend as a percent of business capex crossed over the prior ~10 year average in 2019 and we see that trend extending in early 2020,” according to Morgan Stanley report in June 2020. Strategic product segmentation, sourcing and inventory management. Effective pricing and promotions management.
Seemingly overnight, hard seltzer became the drink of choice in 2019, and largely due to user-generated memes and Twitter posts, the White Claw brand shot to a 54% share of all hard-seltzer sales2 in the U.S. November 2019. Other sources: 1 [link]. Of course, today’s hot item can change on a dime. retail stores. 2 [link].
There are, in fact different phases of procurement value creation that tie into the Source-to-Pay process: . Creating Value occurs when sourcing and procurement uses relevant sourcing processes and tools to engage and select the best fit supplier. What is Direct Procurement? What is Indirect Procurement?
Chip demand rises 17% from 2019 to 2021 as inventory drops from 40 days to 5 days ? For example, collaboration must include a common vocabulary and shared commitment to metrics that matter. Two years in, consumers have a better understanding of supply inter-dependencies and connecting the dots. Workers stay home ? PC demand soars ?
September 26, 2019) A new study by ToolsGroup, a global leader in supply chain planning software, and Spinnaker, a supply chain services company, has found that only 7% of companies are reaping the benefits of digital transformation of supply chain planning. BOSTON, Mass. and HOUSTON, Tex.
” Or alternatively, “Is there data that could be sourced to help?” In Figure 1, we show the aggregate trend of the chemical industry in an orbit chart format showing year-over-year results at the intersection of two metrics operating margin and inventory turns. As a group, we drill into root issues. What is different?
Completed in 2012, the ERP project forced the company to standardize organizational design, roles, and metrics. Nick formed a tight-knit implementation group with business users, and technologists used the backbone of SAP ERP to source master data and transactional flows from SAP and into Orchestr8. The reason? Talking numbers worked.
Many metrics can be used to determine the top 3PL warehousing companies, such as company revenue, the number of warehouses, total warehouse square footage , etc. This compilation is based on the most currently available company revenue data (between 2018 and 2020) without factoring in any other metric. Revenue: €63.3 billion/$72.43
Structured and unstructured data including that from social media, Internet of Things (IoT) and Blockchain sources continue to stream in but much is left untouched. Key Performance Metrics: The ability to identify and measure KPIs will help prioritize and measure transformation efforts. 5 www.transparencymarketresearch.com , 2019.
Macy’s hired its first chief supply chain officer (CSCO) to oversee sourcing, inventory management, distribution, and sustainability. The specific metric used – cargo ton miles – measures the total of tons of cargo moved during a reporting period multiplied by the number of miles flown. This number fell by 5.4%
The new concepts require: digital supply chain execution capabilities in transportation, warehouse, labor and fulfillment digital control towers fueled by artificial intelligence (AI), data science and analytics strategic product segmentation, sourcing and inventory management effective pricing and promotions management.
In fact, IT spend as a percent of business capex crossed over the prior ~10 year average in 2019 and we see that trend extending in early 2020,” according to Morgan Stanley report in June 2020. Strategic product segmentation, sourcing and inventory management. Effective pricing and promotions management.
They must also develop new product ranges, production processes, sourcing strategies and distribution channels. ” Steutermann adds, “It is important not to confuse [sustainability] metrics with the circular economy. 5] Bopro, “ Circular Economy and Supply Chains ,” GRESB, 16 July 2019. [6] Footnotes. [1]
Author Michael Blanding ( @michaelblanding ) reports on the work of two researchers, Mercedes Delgado, professor at Copenhagen Business School, and Karen Mills, a Harvard Business School Senior Fellow, and how they unearthed a source of better jobs hidden in plain sight. ” Smart Industry , 22 April 2019. ” Footnotes. [1]
It helps organizations improve fundamental business metrics such as productivity, product reliability, quality, safety and yield, while reducing downtime and lowering costs.”[3] 4] Kanti S, “ How Cognitive Technologies are Redefining the Future of Manufacturing ,” Analytics Insight , 21 January 2019. [5]
We hope you enjoy this salute to the best of 2018, and we look forward to even more innovations in 2019. The retail giant plans to take out 50 million metric tons (MMT) by 2030, which is equivalent to the emissions associated with the average annual electricity consumption of 40 million Chinese households. Warehouse Automation.
We have established business metrics and we love to quantify our business strategies. Nikos Papageorgiou, Vice President of Solutions at Slync, explains, “Transactions in sourcing, manufacturing, logistics and distribution generate hundreds of millions of data points. Data can be both a blessing and a curse.
It may not be the news you were hoping for, but traditional retail success metrics are fast becoming obsolete in today’s economy. The current suite of metrics were built for a time that no longer exists. Knowing they couldn’t match New York’s money, Beane and James attacked the problem with metrics. Time for action.
This is expected to result in the reduction of over 26 million metric tons of greenhouse gas emissions — the equivalent of taking five million-plus cars off the road for a full year. 4] Alan Buis, “ A Degree of Concern: Why Global Temperatures Matter ,” NASA, 19 June 2019. [5] Footnotes. [1] Footnotes. [1]
We organize all of the trending information in your field so you don't have to. Join 102,000+ users and stay up to date on the latest articles your peers are reading.
You know about us, now we want to get to know you!
Let's personalize your content
Let's get even more personalized
We recognize your account from another site in our network, please click 'Send Email' below to continue with verifying your account and setting a password.


Let's personalize your content