article thumbnail

CPG / Food & Beverage

Vecco International

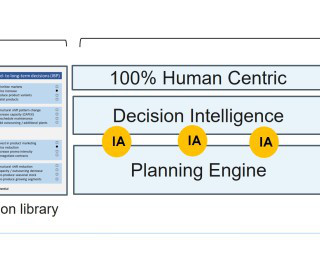
We provide available to promise and capable to promise functionality for a customer order based on approved sourcing for a sales area. Our platform provides visibility into all user defined key supply chain performance metrics. We support collaborative planning and execution both with customers and suppliers.

article thumbnail

PepsiCo’s Massive, Complex, and Difficult Greenhouse Gas Initiative

Logistics Viewpoints

PepsiCo is a very big company, the second largest food and beverage company in the world. PepsiCo generated $79 billion in net revenue in 2021, with 23 food and beverage brands that generate more than $1 billion each in retail sales. 294 manufacturing facilities produced more than 90 million metric tons of food and beverage in 2021.

Insiders

Sign Up for our Newsletter

This site is protected by reCAPTCHA and the Google Privacy Policy and Terms of Service apply.

article thumbnail

How To Leverage The Benefits Of S&OP For The Food And Beverage Industry?

ThroughPut

How To Leverage The Benefits Of S&OP For The Food And Beverage Industry? Supply chain-focused organizations like the food and beverages industry can turn the tide with an efficient S&OP process and improve their overall business performance. How different is S&OP in the volatile world of the food and beverage industry?

S&OP 52
article thumbnail

How To Leverage The Benefits Of S&OP For The Food And Beverage Industry?

ThroughPut

Supply chain-focused organizations like the food and beverages industry can turn the tide with an efficient S&OP process and improve their overall business performance. . How different is S&OP in the volatile world of the food and beverage industry? The food and beverage (F&B) industry is however a different game.

S&OP 52
article thumbnail

Measuring Up?

Supply Chain Shaman

The supply chain is a complex system with finite, and non-linear relationships between supply chain metrics that drive balance sheet results. We find that companies can improve one, but not two of the metrics. Teams struggle to drive improvement in both metrics at the same time. A Look at History. Resiliency.

article thumbnail

Announcing the Supply Chains to Admire for 2019

Supply Chain Shaman

Smaller, more agile companies outperform the larger and well-known brands in the retail, beverages, food, and pharmaceutical industry sectors. The source data for the analysis comes from Ycharts.). We selected these metrics based on correlation work with Arizona State University in 2012. Click the link to see the detail.)

article thumbnail

Supplier Quality Management: What it is, 5 Key Metrics to Know & a 4 Step Supplier Evaluation Process

GlobalTranz

The next posts in the series will break down metrics and issues to consider in SQM by industry and conclude with a case study on the application of SQM. 5 Key Metrics to Use for Scoring Supplier Quality Management (From LNS Research ). The definition of this metric is similar to the way it sounds. Cost of quality.