This site uses cookies to improve your experience. To help us insure we adhere to various privacy regulations, please select your country/region of residence. If you do not select a country, we will assume you are from the United States. Select your Cookie Settings or view our Privacy Policy and Terms of Use.
Cookie Settings
Cookies and similar technologies are used on this website for proper function of the website, for tracking performance analytics and for marketing purposes. We and some of our third-party providers may use cookie data for various purposes. Please review the cookie settings below and choose your preference.
Used for the proper function of the website
Used for monitoring website traffic and interactions
Cookie Settings
Cookies and similar technologies are used on this website for proper function of the website, for tracking performance analytics and for marketing purposes. We and some of our third-party providers may use cookie data for various purposes. Please review the cookie settings below and choose your preference.
Strictly Necessary: Used for the proper function of the website
Performance/Analytics: Used for monitoring website traffic and interactions
For example, integrating renewable energy into supply chains can reduce environmental footprints while enhancing brand equity, demonstrating a commitment to sustainable operations. Public Reporting: Publishing sustainability reports and ethical compliance metrics to highlight progress and areas of improvement.
However, as carbon taxes and emissions reporting requirements continue increasing, supply chain professionals face mounting pressures from inside and outside their organizations to measure and improve performance against new, nebulous sustainability metrics. Sustainability is high on the list of favorite corporate buzzwords.
Patagonia serves as an excellent example of this approach, incorporating recycled materials into its products and offering repair services to minimize waste while maintaining a strong brand commitment to sustainability. Measuring Progress and Building Trust Transparency is essential in sustainability efforts.
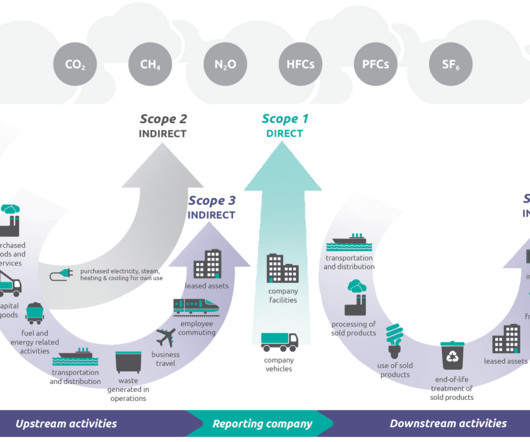
As regulations across the globe strengthen, the pressure to collect, report, and organize emission-related metrics has never been higher. Structure Your Data for Seamless Reporting Most reporting statutes already require or will require companies to provide data for their Scope 1 through 3 emissions.
Just by embedding analytics, application owners can charge 24% more for their product. How much value could you add? This framework explains how application enhancements can extend your product offerings. Brought to you by Logi Analytics.
Use of Supply Chain Descriptors Most organizations are locked into functional silos driven by functional metrics. Stuck in a rut, supply chain leaders try to punch their way through a set of conflicting metrics and priorities each day. The metrics defining success in manufacturing and procurement do not align.
For example, you cannot control governmental policy. In addition, the employees in this role, report the highest job dissatisfaction of anyone in supply chain. I give these three scenarios as examples. Form and socialize your own hierarchy of metrics. For example, don’t focus on forecast error.
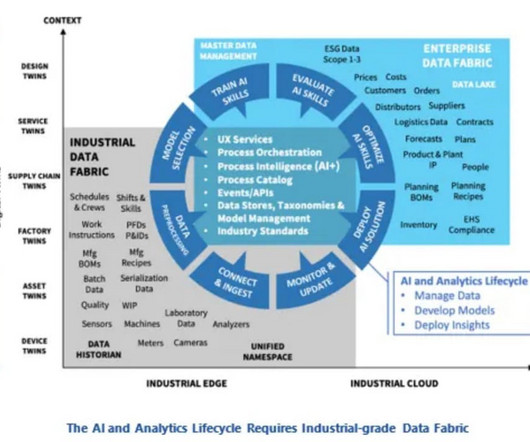
Mr. Masson recently wrote the report “ Industrial-grade AI: Transforming Data into Insights and Outcomes.” Not all the transactional data, just the data required to calculate a metric or make a decision. The platform has thresholds that say, for example, “If the dollar value of orders changes a little, that doesn’t matter.
We consistently see that companies focused on functional excellence–a focus within a functional silo like manufacturing, transportation or distribution– or singular metrics– like inventory or costs– underperform against their peer groups. Let me give you example. Reward teams for cross-functional metrics.
Using balance sheet data from 2011 to 2019, we chart companies’ progress by peer group on rate of improvement and performance in the metrics of growth, operating margin, inventory turns, and Return on Invested Capital (ROIC). This week, while all my friends are on vacation, I am writing the final report for the Supply Chains to Admire.
A disruption at any point in the global logistics network including the average of 12 touch points from shipment packaging to final delivery can prove disastrous for profits, service levels, customer loyalty, and other key metrics. With the global e-commerce market predicted to reach $8.1
The formula for OTIF is: Measuring a supply chain against OTIF metrics is a key strategy that helps decision makers attach a tangible value to the success of their fulfillment and allows them to determine key strategies. Read the full report here. Many companies aim for 95% or higher, which can be a daunting task.
Users are accustomed to building everything in Excel and manipulating the data as needed for their own particular use, typically using static reports or spreadsheets that are siloed in specific departmental needs. A great example of this comes from a Logility customer. Starting at the Top.
As an old gal, with over forty-years of supply chain experience, writing this report for ten years taught me many lessons. I find in the orbit chart analysis that 45% of companies in the report are unconsciously incompetent. For example, in Figure A, we share on orbit chart on how Sanofi is underperforming the industry.
Wikipedia In 2014, I was exploring methods to publish what is now the Supply Chains To Admire report. The use of orbit charts allowed me to see the patterns of performance at the intersection of metrics over time. We have archived corporate reporting from Y charts for 1982-2023. We purchase data from Y charts. (A
At each company, there is a relationship between the metrics of growth, margin, inventory, customer service, and asset strategy. For the purpose of this article, I will use Return on Invested Capital (ROIC) as the proxy metric to discuss asset utilization.) Let’s take P&G as an example. A Case Study. My answer is no.
As a result, the metrics have to be viewed together as a pattern over time. In the journey, the supply chain leader needs to improve the potential of a portfolio of metrics. The metrics of growth, Return on Invested Capital, Inventory Turns and Operating Margin have the highest correlation to market capitalization.
Key Takeaways Develop an understanding of AI Agents and their role in procurement The benefits of using AI agents in procurement, and how they automate workflows Different types of AI agents and examples of procurement use cases Best practices for getting started using autonomous procurement agents What Are AI Agents in Procurement?
Key Takeaways Develop an understanding of AI Agents and their role in procurement The benefits of using AI agents in procurement, and how they automate workflows Different types of AI agents and examples of procurement use cases Best practices for getting started using autonomous procurement agents What Are AI Agents in Procurement?
The time gave me a good time to reflect and finish the reports that I should have completed in the summer when I recovered from Uterine Cancer. Writing and Reflection Completing the edits on the two reports that are publishing soon, felt good. The reports took me two months to write. Today, I wish good health for each of you.
Examples of non-compliant procurement Types of procurement compliance Procurement compliance KPIs Purchasing compliance roadblocks Procurement compliance: Best practices checklist Frequently asked questions about procurement compliance What is procurement compliance? Scroll down to find out: What is procurement compliance?
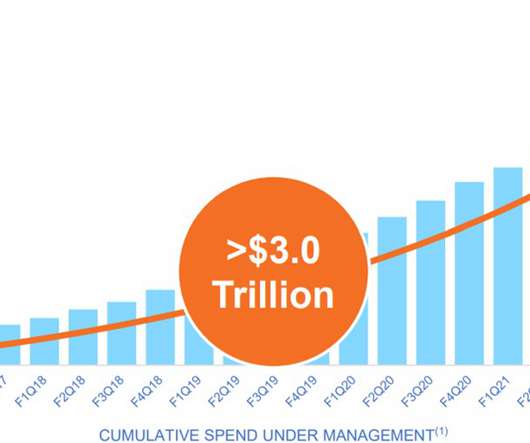
In 2021, Coupa reported losses of $180.1 The Rule of 40 was popularized by venture capitalists in recent years as a key performance metric for SaaS firms. The metric captures the trade-off between short-term viability and the investment in growth. They report that Coupa is at 58.2% on this metric.
This report takes me about six weeks to complete.). One of my stark realizations this year is that smaller companies are beating larger and often more established companies on growth metrics, inventory turns, operating margin, and Return on Invested Capital (ROIC). (In In the report, we study twenty-eight sectors.
We’ll examine the key components of efficient supply chains, explore essential performance metrics, and uncover the fundamental drivers that influence efficiency. Efficient supply chains strengthen collaborative relationships through automated communication systems and shared performance metrics.
How aligned do you believe your organization is to drive these metrics? For example, in the research, I found maturity in Cadbury, DuPont, and Gilette processes. See the World Kitchen case study in the Agility Report. In assessing the health of the plan, what do you measure? Is your plan feasible? Did past plans prove valuable?)
How to establish a category management system Examples of categories and strategies Why category management in procurement matters How Precoro can help you establish a category management system Frequently asked questions about category management services What is category management? Read on to learn: What is category management?
SCB Feature Report From DPW: What’s Next for AI in Supply Chain? Koganti gave the example of the Greeks’ response to the news that the Persians were on their way to invade in the fifth century BCE: Athenian politician and general Themistocles’ response was to urge the building of a navy (which turned out to be devastatingly effective ).
In this guide, we’ll explore what cost efficiency is, examples, and best practices on how cost efficiency can make your company more competitive and profitable in today's fast-paced economy. Example of cost efficiency A TechRepair Company operates two service plans: Plan A costs $6,000 monthly and services 1,200 devices.
According to the Global Supply Chain Disruption and Future Strategies Survey Report, this goal was the top-ranked planned tool investment. This example illustrates why supply chain visibility isn’t enough. In a survey of 150 global manufacturing executives, 47% committed to improving supply chain visibility and tracking.
In preparation for the summit, we readied the final report of the work on translating balance sheet results into a methodology to judge Supply Chain Excellence. This report, Supply Chains to Admire , compares the progress of 200 companies within their respective peer groups on both performance and improvement. Aligned Metrics.
Throughout the supply chain, the use of metrics to track and understand processes provides an invaluable resource for ensuring increased production and customer satisfaction. What Distribution Center Metrics Need Tracking? However, the most important metrics can be categorized into the following eight areas. On-Time Shipping.
Today we published a new report, Supply Chains to Admire. The data analyzed to compile the Supply Chains to Admire report came from publicly-available information from balance sheets and income statements. As a result, we report their results along with their pharmaceutical peer group. It is detailed in our recent reports.
Recent examples included the rollout of a new inventory planning application and the introduction of a hybrid AI-powered demand forecasting engine. Examples included dynamic trailer door assignments, shipment planning enhancements, drag-and-drop yard visualization tools, and integrated labor planning modules.
How are companies rethinking their liquidity management strategies in response to the recent degradation across major working capital metrics? In the wake of economic uncertainty, many companies have experienced a degradation in key working capital metrics.
We’ll walk through key benefits, types of spend analysis, steps to get started, and metrics to track—backed by lessons learned from real-world implementations. Despite investments in tools and data, most procurement teams struggle to scale their efforts beyond one-off reports or limited categories. Let’s dig in! The culprit?
Let’s take an example. If the arrow is red, the industry is moving backwards on a metric. While we agree that each of these companies are leaders with significant contributions to the industry, we do not find these companies outperforming when compared against their peer groups on a balanced portfolio of metrics.
The award, based on beating the industry peer group on rate of improvement on the key metrics of growth, operating margin, inventory turns, and Return on Invested Capital (ROIC) while outperforming their peer group, is tough to achieve. The orbit chart below illustrates L’Oréal’s performance at the intersection of two metrics.
Let me give you an example: Last week, I gave a presentation at a global supply chain team meeting of 175 professionals. This can either be through direct reporting or a matrixed organization. We find the fastest results when the organizations have a direct reporting relationship. It was a large multinational company.
Warehouse Optimization: Testing Without Touching The Carhartt Example: Carhartt adopted a digital twin strategy in partnership with IBM Turbonomic to model application performance and warehouse workflows. Mitigation best practices include cross-functional pilots, strong executive sponsorship, and early wins tracked with business metrics.
In this guide, we’ll unpack the essential functions every ecommerce warehouse must master, along with best practices, real-world examples, and technology tips to help. For example, adding additional warehouse associates during the holidays can have a positive impact on fulfillment speeds. What are warehouse functions?
For example, one of the key decisions that a manufacturer needs to make is should they continue to buy goods from one of their suppliers. For example, are you still a minority owned company? For example, Dun & Bradstreet (D&B) publishes reports on the creditworthiness of companies.
The latter refers to a single variable standard (SVS), by which one metric, such as cases per hour, is expected to tell all. What’s more, because an SVS approach only accounts for one metric at a time, a host of other equally if not more important metrics are bypassed, leaving you largely in the dark. Ad infinitum.
That means identifying areas of waste, overlap and large volumes and enabling continuous improvement through the use of transportation metrics to track performance. Using an offshore vendor to manufacture a component for a larger automotive assembly is a typical example. Outsourcing —the root of managed transportation—is also involved.
Track KPIs, Not Buzzwords Evaluate V2X based on tangible logistics metrics: fuel savings, delivery times, accident rates, and emissions. Carbon-Credited Deliveries Regulators may reward fleets that submit verified low-emission delivery data collected via V2X as part of ESG reporting.
We organize all of the trending information in your field so you don't have to. Join 102,000+ users and stay up to date on the latest articles your peers are reading.
You know about us, now we want to get to know you!
Let's personalize your content
Let's get even more personalized
We recognize your account from another site in our network, please click 'Send Email' below to continue with verifying your account and setting a password.


Let's personalize your content