This site uses cookies to improve your experience. To help us insure we adhere to various privacy regulations, please select your country/region of residence. If you do not select a country, we will assume you are from the United States. Select your Cookie Settings or view our Privacy Policy and Terms of Use.
Cookie Settings
Cookies and similar technologies are used on this website for proper function of the website, for tracking performance analytics and for marketing purposes. We and some of our third-party providers may use cookie data for various purposes. Please review the cookie settings below and choose your preference.
Used for the proper function of the website
Used for monitoring website traffic and interactions
Cookie Settings
Cookies and similar technologies are used on this website for proper function of the website, for tracking performance analytics and for marketing purposes. We and some of our third-party providers may use cookie data for various purposes. Please review the cookie settings below and choose your preference.
Strictly Necessary: Used for the proper function of the website
Performance/Analytics: Used for monitoring website traffic and interactions
However, as carbon taxes and emissions reporting requirements continue increasing, supply chain professionals face mounting pressures from inside and outside their organizations to measure and improve performance against new, nebulous sustainability metrics. Freight transportation makes up over 10% of total global carbon emissions.
A lack of standardized ESG metrics across industries and regions makes it challenging to consistently evaluate and compare supplier performance. Visibility typically decreases beyond immediate (Tier 1) suppliers. Without common definitions, ESG assessments can be inconsistent or incomplete.
Identify What’s Critical Figure out what can’t go down without serious consequences, suppliers, routes, systems, SKUs, or even customers. Use metrics like lead-time sensitivity, margin contribution, and order volume to prioritize. Use a consistent framework to evaluate likelihood and impact.
Readiness Assessment Organizations must begin by conducting a comprehensive readiness assessment to evaluate their current infrastructure, processes, and capabilities. Organizations must also evaluate the quality, integrity, and security of their data to ensure it is reliable enough for DPP purposes.
This session is your guide to evaluating the health of your projects through Waterfall and Agile practices like Scrum and Kanban. We’ll explore the vital signs of project success through the lens of the “iron triangle” metrics, using deliverables as tracers.
Rather than planning based on a single forecast, supply chain teams can evaluate multiple options in parallel: What happens if tariffs increase by 15%? Supplier diversification strategies are no longer framed as a hedgetheyre viewed as standard operating practice. Metrics must reflect the new priorities.
Evaluate Technology Solutions Compatibility with existing technology stack Integration capabilities Scalability Specific business requirements Pro tip: Look for solutions like ToolsGroup that offer award-winning technology with seamless integration capabilities.
We’ll examine the key components of efficient supply chains, explore essential performance metrics, and uncover the fundamental drivers that influence efficiency. Efficient supply chains strengthen collaborative relationships through automated communication systems and shared performance metrics.
Stockouts and overstocks carry serious consequences : the global retail industry loses an estimated $1.75 End-to-end integration : Evaluates multiple demand scenarios to position inventory in the most cost-effective manner possible. Every day spent with suboptimal inventory optimization means lost revenue and opportunity.
Just by embedding analytics, application owners can charge 24% more for their product. How much value could you add? This framework explains how application enhancements can extend your product offerings. Brought to you by Logi Analytics.
Form and socialize your own hierarchy of metrics. Instead, analyze demand flow characteristics by demand stream to evaluate Forecast Value Added (FVA), forecastability, and bullwhip impact. Here is the metrics framework that I am using at present in my outside-in classes. For example, don’t focus on forecast error.
Supplier Performance: Evaluate your vendors’ reliability, quality, and delivery times. Data analytics helps you monitor key performance indicators (KPIs), like supplier performance, delivery times, and transportation efficiency — all in real-time. Demand Forecasting: Analyze past data to predict future needs.
Still, in this article, I will help you evaluate the need for supply chain and logistics KPIs in your organisation, and identify which types of measurement might be most appropriate. Using KPIs for performance measurement ensures that you are continuously evaluating your business activity against a static benchmark. Which ones to use?…
Measuring and Improving Procurement Strategy Performance A successful procurement strategy is data-driven andsupports continuous improvement across key metrics such as cost savings, supplier performance, delivery reliability, and ESG compliance. Clear, measurable outcomes are critical. Further Reading Source-to-Pay vs.
By analyzing how similar products performed, we can estimate demand for a new product, even before it launches. The model evaluates hundreds of variables and identifies the most predictive ones. Unsupervised learning groups new products with similar existing ones using machine learning algorithms. What was the rate of sales growth?
This iterative process of evaluation and refinement encourages a growth mindset, where students are motivated to continuously enhance their skills and knowledge. Courses and modules focused on data analytics, forecasting, and performance metrics equip students with the skills needed to leverage data in optimizing supply chain operations.
Measuring and Improving Procurement Strategy Performance A successful procurement strategy is data-driven andsupports continuous improvement across key metrics such as cost savings, supplier performance, delivery reliability, and ESG compliance. Clear, measurable outcomes are critical. Further Reading Source-to-Pay vs.
Create an index of supply chain metrics. If not already in place, the first step is to create an index of supply chain metrics that help quantify and track interdependencies across the supply chain. It is important to select only those metrics that communicate gaps and how fast they are growing.
Production Capacity Analysis While traditional testing methods can be time-consuming and offer incomplete data, focusing on key production metrics within the manufacturing process provides more actionable insights. Consider these essential metrics: Asset Utilization: How efficiently are your machines being used?
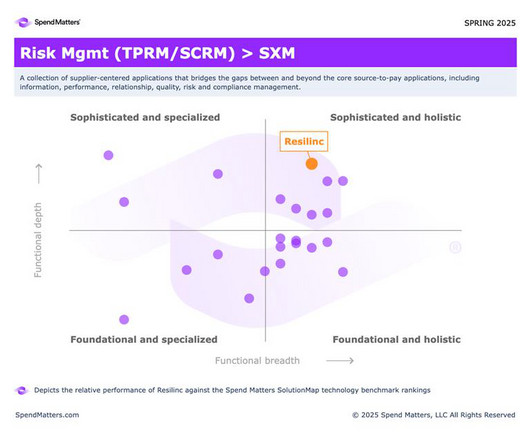
Their comprehensive evaluation highlighted several key strengths: “Resilinc is a robust choice for organizations aiming to grasp and alleviate operational risks in their supply chain. The Numbers That Matter One metric from the Spend Matters analysis stands out above all others: our 9.0 customer satisfaction score.
For example, agentic AI can analyze supplier data, evaluate contracts, manage purchase orders, or recommend sourcing strategies. For supplier sourcing and evaluation, AI-driven tools tap into historical data, market intelligence, and supplier performance metrics to automatically identify the best-fit partners.
For example, agentic AI can analyze supplier data, evaluate contracts, manage purchase orders, or recommend sourcing strategies. For supplier sourcing and evaluation, AI-driven tools tap into historical data, market intelligence, and supplier performance metrics to automatically identify the best-fit partners.
Instead of just asking potential partners to quote on your current operation, youre asking them to reimagine it with you (collaborative tendering). Performance Management Having just three key metrics at each organisational level is a good idea for performance management in logistics.
These systems also support phased implementation, allowing you to start with high-priority processes, train staff during regular work hours, deploy your wireless infrastructure before software rollout, maintain parallel systems during the initial transition, and closely monitor performance metrics.
Whether you’re optimizing for peak season or just starting to explore robotics, clear definitions matter, especially when you’re evaluating vendors, setting KPIs, or aligning operations across teams. Frequently re-evaluated in high-SKU or seasonal environments. A key warehouse efficiency metric that automation is designed to reduce.
Introduction Gardner, (1954) and Huntzinger, (2007) define Purchase price variance (PPV) as a metric used to measure the effectiveness of cost-saving efforts by calculating the difference between the planned cost (standard pricing) allocated for purchasing activities and the actual cost incurred.
Track KPIs, Not Buzzwords Evaluate V2X based on tangible logistics metrics: fuel savings, delivery times, accident rates, and emissions. Adopt Zero-Trust Cyber Practices V2X introduces new attack surfaces. Adopt security platforms that encrypt, authenticate, and monitor every message and device in your connected fleet.
Key components of mobile inventory management include: Smartphone app: Allows field agents to log information, analyze metrics, and manage tasks even in remote areas with limited connectivity. Assessing Business Needs Evaluate your current inventory processes to identify pain points and areas for improvement.
Supplier Integration and Collaboration Building relationships with suppliers who are committed to sustainability is key to reducing your supply chain carbon footprint.
A retailer scorecard is a performance report used by retailers to evaluate how well you’re meeting their delivery standards. Failing to meet expectations can result in: Chargebacks Loss of preferred vendor status Smaller or fewer orders Strained retailer relationships These scorecards are not just internal metrics.
Reputational damage: Negative press or social media backlash from unethical suppliers. Evaluating these risks is essential. That means knowing your suppliers, assessing their reliability, and understanding the downstream effects of interruptions. Use analytics tools to monitor supplier performance and spot red flags early.
Improved Vendor Accountability and Negotiation Leverage With data-backed insights, companies can evaluate carrier performance objectively and use that information to renegotiate contracts or switch providers. Rewarding high performers and holding others accountable becomes a tangible process.
Vendor Performance Reviews Made Visual Procurement teams routinely evaluate vendors based on metrics like delivery timeliness, cost efficiency, quality ratings, and compliance. With timeline visuals, geographic maps, and flow diagrams , managers can illustrate the nature and ripple effects of disruptions clearly.
Tie rewards directly to the metrics that move your business forward. The Interview is Not a One-Way Street You’re evaluating them, but they’re evaluating you too. Know what comparable roles at similar companies are paying in your region, and be prepared to exceed that. Incentives and bonuses: Skin in the game.
Building Stronger Relationship s : Effective Approaches to Multi-Tier Supplier Collaboration A chain is only as strong as its weakest link—but what if you can’t evaluate the entire chain? Tier 1 suppliers and their suppliers—and their suppliers’ suppliers—make up an organization’s multi-tier supply chain.
Monitor Supplier Performance Tracking supplier performance is key to making informed decisions. Kechie ERP with VRM capability helps you monitor metrics like delivery times, product quality, and order consistency. This data is invaluable for evaluatingsuppliers, resolving disputes, or negotiating better terms.
Running procurement and supply chain without metrics is like driving blindfolded. A scorecard acts as your dashboard, providing crucial visibility that helps you: Make Data-Driven Decisions: Replace guesswork with facts when evaluatingsuppliers, processes, and inventory levels. Decoding the Metrics: What Are They Telling You?
If you’re evaluating procurement technology or exploring ways to drive more value from existing systems, chances are you’re looking beyond tactical fixes – you want a smarter, scalable strategy. By consolidating suppliers or bringing unmanaged spend under contract, companies can quickly reduce costs and improve compliance.
AI and ML in production control ML models trained on operational data from an ERP can help achieve significant benefits in key operational metrics like throughput, and OEE. AI algorithms can simulate a variety of scenarios, evaluate potential outcomes and identify the most effective strategies.
The Cost Performance Index (CPI) is a financial efficiency metric used to measure cost performance in projects and operational activities. Measuring Supplier Performance CPI is a valuable metric in supplierevaluation , helping businesses analyze whether suppliers are delivering goods at the expected cost efficiency levels.
This Warehouse Manager’s Playbook offers an actionable roadmap to help you evaluate, pilot, deploy, and optimize warehouse automation with minimal disruption and maximum ROI. Use these criteria to evaluate your options: Criteria Why It Matters Durability Systems should withstand warehouse wear and tear over 5+ years.
The result was 3 cents ahead of the consensus estimate but 28 cents lower y/y. Landstar management views BCO revenue per mile as a more telling metric for TL pricing as it excludes fluctuations in diesel fuel prices.) The metric measures revenue remaining after purchased transportation expenses and agent commissions are paid.)
Each organization must evaluate its unique risks, goals, and capabilities to determine the right mix. They capture engineering changes, CAPAs, training records, and supplier performance metrics. These strategies are not one-size-fits-all.
A website traffic estimator tool can be used to achieve this. Optimization for speed is one of the most recommended SEO best practices because load times directly impact the key metrics used for ranking, especially engagement data and bounce rate. Bounce Rate: Bounce rate is a metric you should not ignore.
We organize all of the trending information in your field so you don't have to. Join 102,000+ users and stay up to date on the latest articles your peers are reading.
You know about us, now we want to get to know you!
Let's personalize your content
Let's get even more personalized
We recognize your account from another site in our network, please click 'Send Email' below to continue with verifying your account and setting a password.


Let's personalize your content