This site uses cookies to improve your experience. To help us insure we adhere to various privacy regulations, please select your country/region of residence. If you do not select a country, we will assume you are from the United States. Select your Cookie Settings or view our Privacy Policy and Terms of Use.
Cookie Settings
Cookies and similar technologies are used on this website for proper function of the website, for tracking performance analytics and for marketing purposes. We and some of our third-party providers may use cookie data for various purposes. Please review the cookie settings below and choose your preference.
Used for the proper function of the website
Used for monitoring website traffic and interactions
Cookie Settings
Cookies and similar technologies are used on this website for proper function of the website, for tracking performance analytics and for marketing purposes. We and some of our third-party providers may use cookie data for various purposes. Please review the cookie settings below and choose your preference.
Strictly Necessary: Used for the proper function of the website
Performance/Analytics: Used for monitoring website traffic and interactions
Carving a successful footprint and managing to boost Peak season value involves the direct application of KPI supply chain best practices. The post KPI Supply Chain: Parcel Metrics to Track and Boost Peak Season Value appeared first on Transportation Management Company | Cerasis.
This has a direct impact on packaging manufacturers who now need to find ways to cope with more diverse demand. The packaging industry is one of intense competition, so individual manufacturers have to keep up. As a result, most packaging manufacturers struggle with delivery reliability and high inventory levels.
Only 7% of respondents use an off-the-shelf package. Our solution enabled them to make KPI-based decisions, implement resilient optimization and smoothen exception management. Over 75% of respondents are using homegrown spreadsheets, which are highly manual, or their ERP, which cannot complete account for complex constraints.
Picking and packing KPIs include the average number of items picked per employee, the total value of picks and their average, the cost per line item, labor costs, the cost of packaging and order cycle times. Shipping KPIs. Shipping KPIs are comparable to picking and packing KPIs. Reverse Logistics KPIs.
Just by embedding analytics, application owners can charge 24% more for their product. How much value could you add? This framework explains how application enhancements can extend your product offerings. Brought to you by Logi Analytics.
To generate true, actionable insights, it is crucial to deploy KPI metrics together with a single source of truth to produce actionable insights that can drive performance results. I also suggest to our clients that they keep the following basic principles in mind relative to their KPI strategies. Supplier KPIs.
Raw and packaging materials are bought at very competitive prices yet with equally favourable payment terms. Overall Supply Chain efficiency is monitored through a short list of highly relevant and stretching KPI targets. Lead times are optimised and stock is on consignment. Supplier collaboration is a key part of the business.
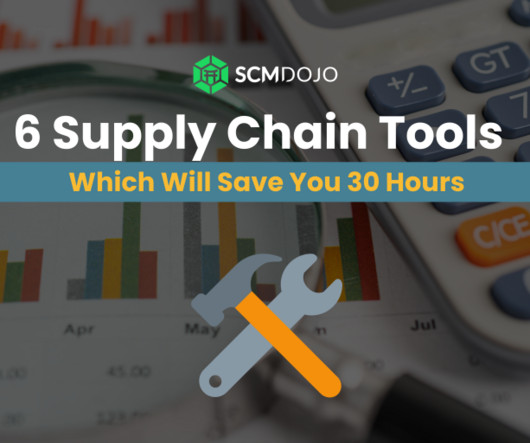
One such tool is the Logistics KPI Dashboard Excel Template, which provides data on key metrics and helps identify areas for improvement. This customizable Excel tool provides a clear definition and measurement of KPIs, helping you keep your targets SMART and drive continuous improvement.
Packaging and Unit Loading Packaging plays a pivotal role in logistical efficiency. Optimizing packaging dimensions can significantly impact transportation and storage costs. Consequently, investing in packaging optimization can yield substantial returns for businesses in the supply chain.
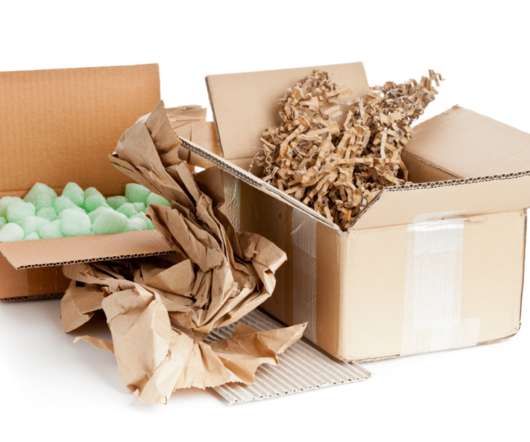
One important consideration that must not get overlooked is the impact the paper and packaging industry has on various transportation services. Every item shipped, whether across town, across the country, or across the globe, requires durable and affordable packaging.
One important consideration that must not get overlooked is the impact the paper and packaging industry has on various transportation services. Every item shipped, whether across town, across the country, or across the globe, requires durable and affordable packaging. Paper Packaging Is Sustainable, Renewable, and Recyclable.
Only 7% of respondents use an off-the-shelf package. Our solution enabled them to make KPI-based decisions, implement resilient optimization and smoothen exception management. Over 75% of respondents are using homegrown spreadsheets, which are highly manual, or their ERP, which cannot complete account for complex constraints.
Raw and packaging materials are bought at very competitive prices yet with equally favourable payment terms. Overall Supply Chain efficiency is monitored through a short list of highly relevant and stretching KPI targets. Lead times are optimised, stock is on consignment and Service Level Agreements (SLA) are in place.
Starting from pre-implementation we align on target key performance indicator (KPI) levels and benchmark progress to accelerate time to value. “In a world that rarely plays by the rules, Michael and Stefano embody ToolsGroup’s relentless focus on delivering value to customers,” said ToolsGroup CEO Joseph Shamir. Go to www.SDCExec.com.
Products come back in dribs and drabs, not in nearly packaged batches. When marketing sees why products are being returned, it can improve product features like quality, packaging, and usability. It would be tempting to think of reverse logistics as forward logistics done backwards. Tempting, but wrong. Almost everything can change.
Products range from packaged explosives (like the plastique you see in the movies), to detonators and bulk slurry type explosives delivered by the tanker load. This included site visits, workshops and the collection of financial, transactional and KPI information from GSK, and their third party logistics providers.
Mitigate Risks: Mitigates risks by including evidence of insurance coverage, proper packaging, and adherence to safety regulations in documentation. Key performance indicators (KPIs) are used to track and evaluate various aspects of logistics operations. Moreover, it helps assess the efficiency of inventory management processes.
Agile supply chain operations, especially in the consumer packaged goods (CPG) industry, are using IoT and end-to-end shipment visibility software to outperform competitors with better service while keeping lower inventory levels. Pro-tip, this, in turn, can improve their On-Time In Full (OTIF) KPI.
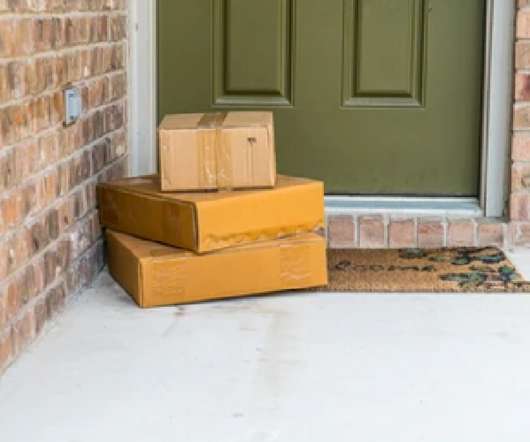
to drop off packages en route to other destinations, according to people familiar with the matter. As envisioned, Amazon would enlist brick-and-mortar retailers in urban areas to store the packages, likely renting space from them or paying a per-package fee, the people said. The crowdsource delivery model is not new.
How do you think about KPI validity? This can be divisive, so KPIs for IBP should be stress-tested periodically. At the outset, your team might designate some KPIs as proxies or provisional based on institutional knowledge until their validity can be proved. Are you willing to act on everything you’re measuring?
The formulae for the PPV is: PPV= (Standard Price – Actual Price) *actual quantity Lets understand this with some examples: Example # 1: A FMCG company plans to purchase 20,000 units of packaging material at an estimated cost of $6 per unit, setting a total budget of $120,000. Check out the Procurement KPI Dashboard now!
The company’s Sail ’27 mission is the second iteration of a plan to “brew for a better today and tomorrow,” plotting a roadmap for a future based on the concept of zero: Zero carbon footprint, zero farming footprint, zero packaging waste, zero water waste, zero irresponsible drinking, and a zero-accident culture.
Put simply, Warehouse KPIs measure how efficiently your warehouse is performing. For example, the warehouse KPI ‘Receiving accuracy’ can determine if your receiving process is as accurate as you need it to be. This KPI helps you understand the efficiency and accuracy of your demand planning and forecasting processes.
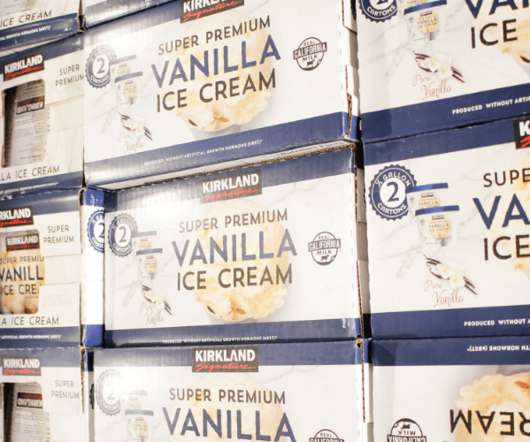
In general, store brands for consumer packaged goods tend to make up approximately 20% market share. Continuous monitoring of store/SKU performance with predefined KPI reporting helps retailers quickly identify assortment and space plan opportunities to make focused adjustments that yield immediate results.
What are ecommerce KPIs? Sales KPIs. Marketing KPIs. Customer service KPIs. Shipping & logistics KPIs. Ecommerce KPI examples. How ShipBob helps retailers track and achieve ecommerce KPIs. What are ecommerce KPIs? Ecommerce KPI examples. Table of Contents. Average delivery days.
For example, a route that is optimized such that a truck needs less travelled distance to deliver the same number of packages, or a production system that saves energy by more efficient batching of products in furnaces. The emissions that are generated to produce or transport, can be greatly influenced by the way supply chains are planned.
If you move freight for a living, you know the importance of logistics key process indicators (KPIs). A KPI is an indicator (a metric) that you have chosen, and agreed with your partners and or customers, that will determine whether you are meeting your critical success factors. Check out another great KPI definition at About.com.
The best LTL KPI for measuring damaged shipments is simply the percentage of damage free shipments delivered. To minimize freight damage, begin measuring it with the damage free shipments KPI. LTL KPI – Damage Free Shipments. Insights from Damage Free Shipment KPI. Does your company use the KPI described above?
The undamaged supplier shipment metric can be used as a KPI to determine if the cycle time for the deliveries to customers is increased when the damaged shipment rate is high. The metric measures the percentage of suppliers that deliver some late shipments and those with none. Quantity of on-time shipments / Total shipments) x 100.
Most software packages show current views of current forecasts, sales, production, and inventory. But what if you wanted visibility of the underlying trends, changes, patterns in all systems. In Search of the Dashboard You Deserve was first posted on December 18, 2019 at 9:50 am.
The carrying cost of inventory KPI should also consider added expenses, like labor costs to manage inventory, insurance, and both packaging and shipping costs. Efficiency and accuracy should be tracked through a common KPI. As a result, Warehouse Managers may need to integrate picker performance metrics with this KPI.
A similar KPI to inventory turnover, average days to sell inventory is intended to measure how long, on average, it takes your company to turn inventory into sales. And the first step to avoiding them in future is to understand when (and how) they occur, which is the intention of this inventory management KPI. Supplier quality index.
CPG Consumer Packaged Goods – Products that are consumed every day by the average consumer, typically sold in packaging, and replaced frequently. KPI Key Performance Indicator – Measurable values that demonstrate how effectively a company is achieving key business objectives.
inventory accuracy 30-42% more efficiency and productivity KPI tracking and improvement Reduced overhead spend (labor, carrying costs, etc.) Read More » Graphic Packaging: Ubiquitous paper goods manufacturer implements mobile barcoding in 25 sites across North America, scaling operations internationally as well.
Mitigate Risks: Mitigates risks by including evidence of insurance coverage, proper packaging, and adherence to safety regulations in documentation. Key performance indicators (KPIs) are used to track and evaluate various aspects of logistics operations. Moreover, it helps assess the efficiency of inventory management processes.
Your fact-finding efforts should seek to determine what your customers want in the following aspects of supply chain service: Packaging and labelling requirements. Ideally, though, evaluating your position against competitors should not solely be a KPI benchmarking exercise. What do You Need to Know? Delivery service levels.
This shift has opened the door for consumer packaged goods (CPG) companies to explore the possibility of their own direct-to-consumer (D2C) propositions. Knowing your customers will give you greater confidence that you’re focusing on the right KPIs, which inform optimum volumes of products for your B2C operations.
Both help assure that packages are correctly labeled and addressed. This type of solution can prevent misships by lowering the risk of lost or misdelivered packages. Advanced mobile solutions like those provided by RFgen can combine the most-needed functionality of all these technologies into one robust but flexible package.
That is, COGS covers the direct costs of making a product – so raw materials, labour, packaging, purchase cost from a wholesaler, and so on. Shrinkage is a big red flag KPI, showing you that you’re losing money. Cost of goods sold (COGS) COGS calculates the total amount that your business has paid to produce its product or service.
eCommerce packages from $205 per month, 3PL packages from $480 per month eCommerce businesses and third-party logistics providers. eCommerce retail packages start at $205 per month and include core order, inventory, and warehouse management tools necessary for streamlining order fulfilment.
At the same time, ESG is increasingly becoming a key performance indicator (KPI) to measure business success. We’re working towards this goal by moving to lower carbon forms of transport and renewable sources of electricity as well as increasing use of recycled packaging while reducing the amount of packaging overall.”
As procurement experts, here are some KPIs we would recommend starting with: Percentage of spend on sustainable products/services : This KPI measures the percentage of total procurement spend on products or services that meet the organization's sustainability criteria, such as being environmentally friendly and socially responsible.
Technology can automatically track many KPIs for you or bring together data that allows you to run thorough reports. Not only can you use KPI data and insights to follow carrier agreements, but you can also use the data to strategize more effective methods for a better-optimized network overall.
In the UK, for instance, recent government legislation restricts the promotion of pre-packaged food that is high in fat, salt, or sugar (HFSS). This affects manufacturing methods in terms of both production and packaging. Wintertime is a killer here,” states Kimmel when talking about meeting the on-time delivery KPI at a rural site.
We organize all of the trending information in your field so you don't have to. Join 102,000+ users and stay up to date on the latest articles your peers are reading.
You know about us, now we want to get to know you!
Let's personalize your content
Let's get even more personalized
We recognize your account from another site in our network, please click 'Send Email' below to continue with verifying your account and setting a password.


Let's personalize your content