This site uses cookies to improve your experience. To help us insure we adhere to various privacy regulations, please select your country/region of residence. If you do not select a country, we will assume you are from the United States. Select your Cookie Settings or view our Privacy Policy and Terms of Use.
Cookie Settings
Cookies and similar technologies are used on this website for proper function of the website, for tracking performance analytics and for marketing purposes. We and some of our third-party providers may use cookie data for various purposes. Please review the cookie settings below and choose your preference.
Used for the proper function of the website
Used for monitoring website traffic and interactions
Cookie Settings
Cookies and similar technologies are used on this website for proper function of the website, for tracking performance analytics and for marketing purposes. We and some of our third-party providers may use cookie data for various purposes. Please review the cookie settings below and choose your preference.
Strictly Necessary: Used for the proper function of the website
Performance/Analytics: Used for monitoring website traffic and interactions
Despite the evolution of technology, none of the 28 industry segments I follow can drive improvement at the intersection of operating margin and inventory turns. Functional Metrics and the Lack of Alignment to Strategy. Figure A: Beverage Industry Aggregate Industry Trend 2014-2023 Figure B. Change is Hard. Guess what?
Do Set Clear KPIs and Governance Structures : Establish transparent metrics for sales, coverage, and service levels. Do Embrace Technology and Data : Use real-time data for demand forecasting, inventory management, and route optimization. A well-equipped distributor is an extension of your brand and a key to market penetration.
By harnessing the growing power of AI to not only sense demand at a very fine-grain, real-time level, but also to govern decisions about pricing and inventory. In terms of inventory strategy, First Insight assigns each SKU a unique “Value Score” based on a range of factors, including pricing, likeability and consumers’ likelihood of purchase.
An average margin of 21% with inventory turns of 1.58 As shown in Figure B, the company improved cash-to-cash through the extension of payables, but never improved inventory levels after the spin-off from Kraft. The group’s response is, “Are these supply chain metrics?” show a clear gap in performance.
The use of orbit charts allowed me to see the patterns of performance at the intersection of metrics over time. The second part of the story is that inventory turns for Lenovo are 10.8, Ranking at #13, PepsiCo outperforms on inventory turns, but performance is declining. For the past decade, I have been studying these patterns.
by Jeswin Philip The Food Packaging Trends and Advances report from PMMI forecasts that the US Food and Beverage industry will experience a 2.9 % CAGR through 2022. As with any industry, food and beverage faces its own unique set of supply chain challenges, including: Expiring ingredients, manufactured product and packaged goods.
Only four percent of companies compared to their peer groups improved balance sheet performance of growth, operating margin, and inventory turns. When compared to pre-recession years, we ended the decade with twenty more days of inventory. Days of Inventory Comparison. The second story is about a regional beverage manufacturer.
I just don’t think the comparison of very different industries in a spreadsheet based on growth, inventory values, and Return on Assets (ROA) is meaningful. As a result, the metrics have to be viewed together as a pattern over time. In the journey, the supply chain leader needs to improve the potential of a portfolio of metrics.
The research tries to establish “ who did supply chain best ” by looking at a weighted formula of Year-over-Year Growth, Return on Assets (ROA), and Inventory Turns for the Fortune 500 companies. Inventory Turns values are based on an average of quarterly reporting for the past year. Inventory Turns is only part of the story.
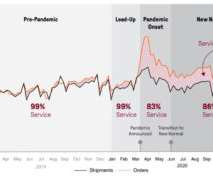
A study by E2open – the 2021 Forecasting and Inventory Benchmark Study: Supply Chain Performance During the Covid-19 Pandemic – provides the answers. The company provides demand and inventory planning solutions based on a public cloud architecture. I look forward to this study every year. Forecasting Accuracy Was Terrible .
While the performance rankings were based on comparisons of inventory turns, operating margin and Return on Invested Capital (ROIC) for the periods of 2006-2013 and 2009-2013, the concept is that to be a supply chain leader you must outperform and drive improvement. Aligned Metrics. Supply Chain Design. Strong Planning Capabilities.
Smaller, more agile companies outperform the larger and well-known brands in the retail, beverages, food, and pharmaceutical industry sectors. It is not as simple as trading-off inventory, cost, and customer service. We selected these metrics based on correlation work with Arizona State University in 2012. Celebrating Success.
Inventory, in this time of uncertainty, is the organization’s most important buffer to protect against variability. However, organizations are not good at managing inventory. Cash-to-Cash Metrics. Cash-to-cash is a compound metric: (Days of Receivables+Days of Inventory)-Days of Payables=Cash Conversion Cycle.
The impact of complexity on inventory is not quick. To help, today I want to share some of the insights from our recent Inventory Optimization study. Inventory management is a hot issue. Companies invest in project after project, yet inventory levels remain the same. The Business Problem. The analogy is weight loss.
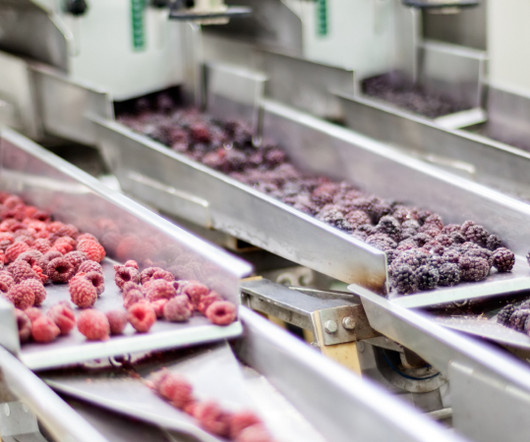
Food and beverage manufacturing and distribution companies usually operate on smaller margins than most organizations in other industries. Unfortunately, a significant chunk of food and beverage companies’ raw materials are commodities, whose prices don’t just fluctuate from month to month but can change hour-by-hour.
The latter refers to a single variable standard (SVS), by which one metric, such as cases per hour, is expected to tell all. What’s more, because an SVS approach only accounts for one metric at a time, a host of other equally if not more important metrics are bypassed, leaving you largely in the dark. Inventory mix.
That’s where manufacturing inventory management software comes in. In this ultimate guide, we’ll break down everything you need to know about manufacturing inventory management software. Its your single source of truth for inventory, constantly updated and readily available.
The food and beverage industry is an ever-fluctuating landscape with a constant demand for operational efficiency. This is especially critical in industries like food and beverage, marked by short product shelf lives and significantly varying demand. Second, the addition of financial metrics into the process which now gives us IBP.
The supply chain is a complex system with finite, and non-linear relationships between supply chain metrics that drive balance sheet results. In our analysis, only one out of ten companies successfully improves operating margins and inventory turns at the same time. We find that companies can improve one, but not two of the metrics.
The beverage industry offers a valuable example. These outdated methods are inefficient, error-prone, and difficult to scale. Establishing baselines, tracking reductions, or meeting compliance requirements without having accurate, standardized data becomes nearly impossible.
Unlike most of the KPIs we recommend, perfect order is a composite of several elementary metrics. Damage-free delivery: This measurement is sometimes incorporated into the in full KPI, but can just also be a stand-alone metric. What about DIFOT?
Humans will still be very much in the picture, he argued, but one of the most important elements in the relationship between human and machine will continue to be trust.
From retail and food and beverage to manufacturing and life sciences, companies from a wide variety of industries are realizing the benefits of the technology, revolutionizing how they operate, collaborate, and generate value. Retailers are leveraging cloud-based platforms to optimize inventory management and enhance customer engagement.
The next posts in the series will break down metrics and issues to consider in SQM by industry and conclude with a case study on the application of SQM. 5 Key Metrics to Use for Scoring Supplier Quality Management (From LNS Research ). The definition of this metric is similar to the way it sounds. Cost of quality.
My caution is not so fast… 95% of companies are not making progress at the intersection of growth, operating margin, inventory turns and asset strategies. Figure 1: Supply Chain Metrics Are a Balancing Act. The metrics shown in Figure 1 are difficult to improve together. This is especially true for the Titans.
We determine which companies have driven higher levels of improvement (based on Supply Chain Index calculations) and shareholder value (as defined by Price to Tangible Book Value) while outperforming their peer group on growth, operating margin, inventory turns and Return on Invested Capital (ROIC). The Results.
The global alcoholic beverages market is forecast to grow to $3,875 billion by 2032. The global non-alcoholic beverage market size is projected to grow to $3.8 At the same time, beverage producers, like food producers and others, are being pressured in multiple directions. trillion by 2034.
Here “near real-time” is defined as a refresh of key metrics every five minutes. The customers at the conference included very large food & beverage companies, the largest 3PL in the world, and companies from other industries as well.
The company is a food and beverage company. In Figure 1, we show the aggregate trend of the chemical industry in an orbit chart format showing year-over-year results at the intersection of two metrics operating margin and inventory turns. inventory turns. for inventory turns define best-in-class performance?
Advertise Contact Us Supplier Directory SCB YouTube About Us Login Subscribe Logout My Profile LOGISTICS Air Cargo All Logistics Facility Location Planning Freight Forwarding/Customs Brokerage Global Gateways Global Logistics Last Mile Delivery Logistics Outsourcing LTL/Truckload Services Ocean Transportation Parcel & Express Rail & Intermodal (..)
Inventory Turns (15%) (based on 2014 results). Supply chain leaders manage a complex system of non-linear, but very inter-connected metrics. Leaders need to balance a portfolio of metrics. Year-over-year Improvement at the Intersections of the Metrics. A Three-year Weighted Return on Assets (ROA) Number (25%).
We have found that supply chain metrics are gnarly and complicated.During We believe that a supply chain leader is defined by both the level of performance on the Effective Frontier (balance of growth, Return on Invested Capital, Profitability and Inventory Turns) and driving supply chain improvement.
Compliance and quality are the foundations all great food & beverage manufacturers rely on to create and strengthen trust with their distribution networks and customers. Traceability Is Key To Excelling At Compliance And Quality for Food & Beverage Manufacturing Companies.
RELATED CONTENT RELATED VIDEOS Technology Sourcing/Procurement/SRM Supply Chain Security & Risk Mgmt E-Commerce/Omni-Channel Food & Beverage Retail Related Articles New Era at Amazon’s Whole Foods Grates on Some Suppliers, Employees F.D.A. UNFI ), one of the U.S.’s UNFI ), one of the U.S.’s UNFI ), one of the U.S.’s
In sectors where product assortments shift throughout the year, for example, AS/RS may require different bin sizes to accommodate new inventory, while P2G operates independently of bin structures, allowing for seamless transitions. Risk Mitigation and Financial Stability The same flexibility helps mitigate longer-term financial risk.
Overall Results on the Supply Chain Metrics That Matter. In the last five years, consumer products and food/beverage leaders faced different challenges. Overall, in the industry, there is more forward momentum in consumer products sector than the food/beverage peer groups. How Have They Done? They cannot be grouped together.
So your company is looking to reduce costs, and you’ve been asked to contribute by reducing your inventory cost. That makes sense – inventory is one of the most capital intensive areas for any product business. Here we explain how you can do this with 16 cost reduction strategies in inventory management?that
It also requires detailed inventories of hazardous materials; To support developing countries, IMO has organized various workshops on ship recycling to raise awareness of the Convention internationally.
Supply Chain Finance & Revenue Management Lawyer for 737 Crash Victim Families Slams DOJ Deal with Boeing Quality & Metrics DHL Express Canada Workers on Strike Following Lockout Last Mile Delivery U.S. Featured Product Popular Stories Watch: Why Choose FTZs to Mitigate Tariffs?
Advertise Contact Us Supplier Directory SCB YouTube About Us Login Subscribe Logout My Profile LOGISTICS Air Cargo All Logistics Facility Location Planning Freight Forwarding/Customs Brokerage Global Gateways Global Logistics Last Mile Delivery Logistics Outsourcing LTL/Truckload Services Ocean Transportation Parcel & Express Rail & Intermodal (..)
Supply Chain Finance & Revenue Management Lawyer for 737 Crash Victim Families Slams DOJ Deal with Boeing Quality & Metrics U.S. Featured Product Popular Stories Watch: Why Choose FTZs to Mitigate Tariffs?
Regulators are seeking “to put pressure on fashion brands to make sure they’ve got better inventory control in terms of not over-ordering.” In the EU, “a heck of a lot” of new fashion apparel goes straight to landfill at the end of its life, he says.
I was on a call last week with a large company in the food and beverage space that has spent $100s of millions, and many years, on an ERP deployment. The issue is that none of their IT investments in the last 10 years have moved the needle on operational metrics such as inventory levels, case fill rates, and other operational metrics.
We organize all of the trending information in your field so you don't have to. Join 102,000+ users and stay up to date on the latest articles your peers are reading.
You know about us, now we want to get to know you!
Let's personalize your content
Let's get even more personalized
We recognize your account from another site in our network, please click 'Send Email' below to continue with verifying your account and setting a password.


Let's personalize your content