This site uses cookies to improve your experience. To help us insure we adhere to various privacy regulations, please select your country/region of residence. If you do not select a country, we will assume you are from the United States. Select your Cookie Settings or view our Privacy Policy and Terms of Use.
Cookie Settings
Cookies and similar technologies are used on this website for proper function of the website, for tracking performance analytics and for marketing purposes. We and some of our third-party providers may use cookie data for various purposes. Please review the cookie settings below and choose your preference.
Used for the proper function of the website
Used for monitoring website traffic and interactions
Cookie Settings
Cookies and similar technologies are used on this website for proper function of the website, for tracking performance analytics and for marketing purposes. We and some of our third-party providers may use cookie data for various purposes. Please review the cookie settings below and choose your preference.
Strictly Necessary: Used for the proper function of the website
Performance/Analytics: Used for monitoring website traffic and interactions
Most of the business networks were hollowed out by venture capitalists or purchased by opportunists. On December 5th, Supply Chain Insights is hosting a small event at Georgia Tech to share the results of a two-year research effort to connect financial metrics by industry to supply chain performance to drive value.
The award, based on beating the industry peer group on rate of improvement on the key metrics of growth, operating margin, inventory turns, and Return on Invested Capital (ROIC) while outperforming their peer group, is tough to achieve. The orbit chart below illustrates L’Oréal’s performance at the intersection of two metrics.
How Do You Define Excellence? In retrospect, I find that technology is an enabler, but only if we are clear on what defines supply chain excellence. Many believe that an ex-supply chain exec knows the definition of supply chain excellence. However, the key part of this comparison is the fact that Sanofi never drove improvement.
Clear operating strategy and definition of supply chain excellence across plan, source, make and deliver. Most companies buy decision support technology, but do not redefine work to improve decisions. A shift from functional metrics to a balanced scorecard. The focus on functional metrics sub-optimizes balance sheet results.
Ultimately, what KPIs, as metrics and indicators derived from the set of plans are taken into account and prepared for each scenario. For the decision making process, the comparison of scenarios in an easy and objective way based on the indicators allows the choice based mainly on a rationalized financial criteria.
Gartner purchased the firm in 2010.) Driving Improvements in Supply Chain Excellence. He felt strongly that supply chain leaders knew how to drive supply chain excellence and needed a forum– or maybe two or three depending on the business model– to help them network and refine their approaches. I disagreed.
Here are the three questions that I would like people to ask: Table 1: Comparison of Results for Best of Breed Solution Providers to ERP Expansionists in Supply Chain Planning. By purchasing planning and transactional systems for a common vendor, they had one throat to choke and they were familiar with the architectural elements.
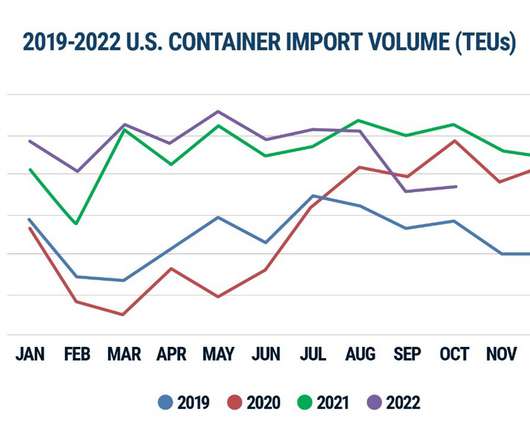
Container Import Volume Year-over-Year Comparison. Theme 2: Online buying will fuel home delivery growth, challenges and new strategies. In 2023, consumers will be less forgiving and poised to buy from retailers whose delivery performance is commensurate with the rest of the shopping experience. Figure 1: U.S.
It was a story where people believed that functional excellence leads to supply chain superiority. Year after year, well intentioned people toiled against improving metrics that reduced, not improved, the effectiveness of the supply chain. Metricscomparison of Kellogg Co. You got it! vs. General Mills, Inc. A Case Study.
There is an inverse relationship between margin and supply chain excellence. Note that in this comparison of the top three medical device companies in Figure 1, that Zimmer is substantially underperforming against the other two, and that all three companies are going backwards in operating margin. I don’t think so. My Challenge.
The focus is on the role of supply chain finance in driving supply chain excellence. The design of the conference includes tours of several modern warehouses and centers of excellence. A simplistic view is that supply chain excellence is the trade-off of cost, inventory and customer service. The River of Demand. #3
To drive global scale, companies need to design the supply chain to buy globally and execute locally. The company leverages globally sourcing strategies to buy products at a lower cost and then deploys some unique process logic to drive mass customization for retailers. Performance on the Supply Chain Metrics That Matter.
She works with supply chain leaders to take teams to higher levels of excellence and is an influencer with more than 340,000 followers on LinkedIn. How often do your purchase orders change? For example, if your supplier is on wafer-thin margins, it may be bulk purchasing in order to reduce costs, leaving it with excess stock.
The study is primarily a comparison of best-of -breed solution providers (Logility, JDA, Kinaxis and OM Partners) versus SAP and Oracle. Buying these solutions is far more complicated than is represented in a simple four-box quadrant. Lora thinks that we are never too old to learn or to push for excellence. It is complex.
Executive, after executive, lament, “They have purchased many technologies and sponsored many projects to reduce inventories, but they are not seeing results.” We are systemically evaluating each industry in the Supply Chain Insights Metrics That Matter series of reports. At Supply Chain Insights , this is our passion.
I was an avid student of supply chain excellence; and in this role, I watched as best-of-breed solution after best-of-breed solution replaced with more complicated technology. It is a comparison of business pain for the past five years and future five years. Buying patterns are changing quickly, and the insights are multi-dimensional.
The inherent buying patterns of consumers are also changing. Purchases in the center store of the grocery store are in decline, and apparel tastes are shifting. Too few companies have the discipline to measure Forecast Value Add–comparison to the naive forecast–and drive improvement. Simply put, it is expensive.
Volatility in pricing trends are opportunities to lock in contractual rates, though shippers and logistics providers must also maintain flexibility to leverage spot buys as needed. If so it may be impossible to conduct an apples-to-apples comparison. Adopt performance metrics for carriers. It is still a people business.
Suppliers can provide raw materials for manufacturing products or act as an intermediary between the manufacturer and the buying company. Retail shops are vendors for each individual customer buying sneakers. It would make more sense to buy lemonades rather than produce them in-house. Blurred lines.
They expect to be able to make purchases and receive service in that same lightening quick timeframe. Easy Scenario Comparisons. But with advancements in the tools available, it is possible to use scorecards to easily compare multiple scenarios, allowing you to quickly see how each compares against a set of key performance metrics.
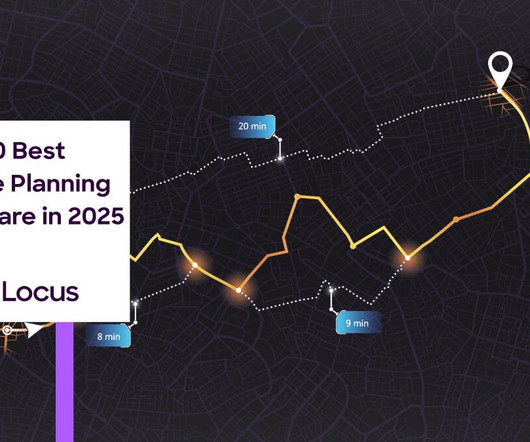
Top 10 Route Planning Software Solutions: Overview Here’s a quick comparison of the top route planning software solutions in 2025. Businesses looking to offer more personalized or on-brand post-purchase communication may find the system somewhat restrictive compared to more configurable alternatives.
This blog explores the trends that define this year’s holiday season and the factors that draw the consumer path to purchase. Consumers leverage AI-powered benchmarking tools to track the price of their favorite items and make the purchase once it hits its lowest point. compared to the last year.
Streamlines Internal Procedures Spending data analysis sheds light on similar purchases between different departments. It enables them to cooperate even more closely to create fewer purchase orders and get things done faster by grouping multiple items and services into one purchase. Let's learn more about them.
I am buying a sheep and goat farm alongside a larger space for a garment factory so that I can control where the cashmere and wool is coming from, how it is processed and how it is manufactured before it is sent to my customers. If you want to optimize your supply chain, the way to do it best isn’t to buy some fancy new machine.
With so many changing variables, excel sheets or human intervention alone can’t gain the level of visibility needed to forecast the future. Your sourcing department can save valuable time because AI tools analyze suppliers with the aid of relevant data points and metrics and match them with the contract opportunities available.
Excellent firms don’t believe in excellence – only in constant improvement and constant change. What Is Supply Chain Excellence? My second observation is that for 96% of public companies supply chain excellence is slip-sliding away. Reflections on Excellence. Tom Peters. Here, in this blog, I explain.
When Gartner purchased AMR Research in December 2009, the methodology became the Gartner Supply Chain Top 25. The first step was to charter a research project with the Arizona State University statistics department to analyze which combination of metrics drives the highest market capitalization. The result? The reason?
Many of my clients talk about a customer-centric supply chain but rely on useless metrics from an annual survey or a net promoter score. Foundational to supply chain excellence is the reliability of delivery, quality, and service. The Sleep Number Story of Supply Chain Excellence. Defining the Customer-Centric Supply Chain.
In comparison, in 2000-2007 the U.S. Financial performance metrics are valuable as they capture the economic consequences of business decisions. Where is the metric for determining the sources and uses of cash from three perspectives - operational, investment and financial? locations to be in close proximity to the U.S.
Procurement, or Purchasing, is an area of Supply Chain that involves and requires very specific skills and expertise. Regardless of your position or situation it is highly valuable to understand the type of interview questions, and answers, appropriate for Procurement and Purchasing professionals. Subscribe Here! Email Address.
On August 13th, Infor announced the intent to purchase GT Nexus for 675M$. The largest was the purchase of Lawson in 2011 for 2B$. The company branded as GT Nexus in 2001 and purchased Tradecard in 2013. While many will compare you to SAP, it is not a comparison. GT Nexus began operations in 1998 using the name Tradiant.
Get More Out of Your Kroger 84.51° and Market6 Data How Automation and Advanced Metrics You Won’t Get in 84.51° can help you grow your sales at Kroger and avoid inventory headaches. The purchase of Market6 was an effort by 84.51° to fill this gap, and in some ways it did. The 84.51° helps brands better understand their customer.
The Focus Inside-out Supported by Functional Metrics. Functional excellence drove regional supply chain performance in the 1990s, but a focus on functional metrics in large, global and complex supply chains over the last two decades threw the supply chain out of balance. Supply Chain Maturity Progression. Winners Over Time.
They help procurement managers track and measure performance metrics, such as quality, delivery, cost, and compliance, to guide contract renewals and drive continuous improvement. Key metrics to track on your vendor evaluation scorecard Measure only what counts most. Comparison to alternate suppliers (benchmarking).
Commandment 9: Insist on User Friendliness Independent of the effort put forth to design a system, purchase hardware and develop software, the single biggest test of implementation occurs when an operator attempts to scan bar coded media. In comparison, in 2000-2007 the U.S. locations to be in close proximity to the U.S.
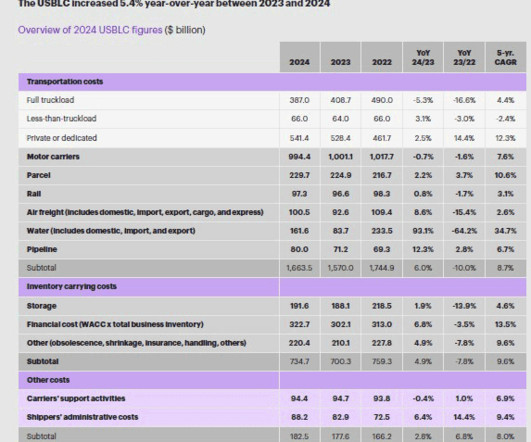
Since the report’s inception, total USBLC is then divided by nominal US GDP to calculate logistics costs as a percent of GDP, which can be used for comparisons across years. CSCMP members can download a copy for no charge, and others can purchase one for a modest fee. In comparison, in 2000-2007 the U.S. trillion, up from $2.44
In comparison, in 2000-2007 the U.S. Financial performance metrics are valuable as they capture the economic consequences of business decisions. Where is the metric for determining the sources and uses of cash from three perspectives - operational, investment and financial? locations to be in close proximity to the U.S.
In comparison, in 2000-2007 the U.S. Financial performance metrics are valuable as they capture the economic consequences of business decisions. Where is the metric for determining the sources and uses of cash from three perspectives - operational, investment and financial? locations to be in close proximity to the U.S.
We organize all of the trending information in your field so you don't have to. Join 102,000+ users and stay up to date on the latest articles your peers are reading.
You know about us, now we want to get to know you!
Let's personalize your content
Let's get even more personalized
We recognize your account from another site in our network, please click 'Send Email' below to continue with verifying your account and setting a password.


Let's personalize your content