This site uses cookies to improve your experience. To help us insure we adhere to various privacy regulations, please select your country/region of residence. If you do not select a country, we will assume you are from the United States. Select your Cookie Settings or view our Privacy Policy and Terms of Use.
Cookie Settings
Cookies and similar technologies are used on this website for proper function of the website, for tracking performance analytics and for marketing purposes. We and some of our third-party providers may use cookie data for various purposes. Please review the cookie settings below and choose your preference.
Used for the proper function of the website
Used for monitoring website traffic and interactions
Cookie Settings
Cookies and similar technologies are used on this website for proper function of the website, for tracking performance analytics and for marketing purposes. We and some of our third-party providers may use cookie data for various purposes. Please review the cookie settings below and choose your preference.
Strictly Necessary: Used for the proper function of the website
Performance/Analytics: Used for monitoring website traffic and interactions
The SAS forecasting system implemented in 2019 was not tested for model accuracy. An example for this client would be to use 2017 and 2018 history to forecast 2019. So, I asked the questions, “Is your data forecastable? Data at this level of variability is complicated to forecast.) The reason? The answer?
One of my stark realizations this year is that smaller companies are beating larger and often more established companies on growth metrics, inventory turns, operating margin, and Return on Invested Capital (ROIC). (In The metrics selection resulted from work with Arizona State University in 2013.) Look for the full report next week.).
Relatively few companies have adequate measures of order fill rates or forecast accuracy. To fill the 8th line item complete we had to ship the product from a DC across the country. Make it your New Year’s resolution to start using this more granular metric. Don’t Forget to Measure Forecast Accuracy, Too.
It also suggests that the total value delivered by AI will be more limited than consultants from McKinsey are forecasting. It is better to receive inventory on a loading dock, take the inventory needed for a hot shot shipment, and move that inventory through the DC to a shipping dock where it is loaded on a truck.
Forecasting and new product introduction has always been the issues for many FMCG companies, P&G is no exception. The result is that the forecast accuracy is improved because a demand planner has an additional source data to make a better decision. . BMW uses a 12-year planning horizon and divides it into an annual period.
Using POS Data for Improved Sales & Demand Planning By leveraging POS data, companies can additionally (and accurately) forecast future sales, which is crucial for demand planning. Improved Forecast Accuracy Since POS data reflects real consumer purchases, forecasts based on this data are more accurate.
Demand sensing involves the use of the external data sources – particularly the latest sales and market data – to improve short-term forecasting and then be able to use that improved understanding of consumer behavior to improve their supply planning. The stock rebalancing skill is designed to enable Mars to optimize DC to DC shipments.
The focus needs to move from functional metrics to balanced scorecard outcomes. Functional metrics insulate organizations and throw the supply chain out of balance. Traditionally, demand planning was chopped up into many applications—demand planning, forecasting by finance, revenue management, and sales account planning.
Introduction I started to write a “Demand Forecasting 101” article but decided that was going to turn into another Ph.D. This is a list of things that I learned about demand forecasting early in my career – things that would have been nice to know from day one. But this list is agnostic of the particular forecasting technology used.
Introduction I started to write a “Demand Forecasting 101” article but decided that was going to turn into another Ph.D. This is a list of things that I learned about demand forecasting early in my career – things that would have been nice to know from day one. But this list is agnostic of the particular forecasting technology used.
Learn how to: Keep your logistics on time and prepared Maintain your replenishment goals Properly forecast and redefine your demand plan Use technology to help. You should also check your event forecast frequently, multiple times per week preferably. Forecasting. Other considerations. How SupplyPike is helping.
Most companies do not analyze the coefficient of variation (how forecastable the data is), the quality of the demand forecast (Forecast Value-Added) , or the impact of the latency from the dependency on the order signal in the distortion and amplification of the supply signal (bullwhip effect).
While extremely valuable, any reputation forecasting has can quickly be tarnished by bad experiences. A more fundamental issue is knowing what business problems forecasting can address. Outlined below are five of the best use cases for forecasting based on dozens of projects our customers have executed with our technologies.
Forecast demand better. Reverse Logistics Strategy 3: Make it Profitable It makes sense to run reverse logistics as a profit centre with corresponding KPI and metrics. Yet reverse logistics is largely the result of marketing and product design decisions at the beginning of the lifecycle. Speed will be an important factor.
Amanda has been using some of the common metrics for forecast accuracy, including MAPE (mean absolute percentage error) and weighted MAPE, but the statistical forecast doesn’t seem to improve and the qualitative inputs from marketing and sales are hit or miss. Amanda’s company just bought a commercial forecasting package.
Units on Hand Units on Hand is the number of units of a product that are physically available at a given point along the supply chain, such as a store or retailer DC. Furthermore, it’s needed to calculate a number of key metrics that are leading performance indicators and watched closely by brands and retailers: Inventory turnover.
Without a shared set of metrics between the commercial and operational teams, it is extremely difficult to get alignment between them. Examples of shared metrics include customer service levels, inventory turns, sell-through forecast accuracy, total landed cost, and overall profitability of the business.
Indicating that Generative AI and agents are increasingly capable of supporting more capabilities, Jassy specifically indicated that AI will improve inventory management, product demand forecasting and the efficiency of work assisted robots: “ Agents will allow us to start almost everything from a more advanced starting point.”
With the right data visibility, suppliers can reduce out-of-stocks by leveraging real-time DC and store-level information to implement more effective stock management strategies. Velocity metrics often convince retail buyers to add products to their assortments, with some having minimum velocity requirements.
DC Velocity). FedEx forecasts higher profit for FY 2018 (Reuters). Consumer Convenience” will become a new supply chain metric (more on that idea in a future post). Rigged: Port trucking companies forcing drivers to finance their own trucks by taking on debt they could not afford (USA Today). Carrier warehousing, anyone? (DC
Freight brokers that try to rapidly enter the market without the technology and ability to really compete with their competitors, i.e. “work with shippers to secure more bookings,” always fail, notes DC Velocity. According to TruckingInfo , “that gives us the capability to forecast out much farther than our competitors.
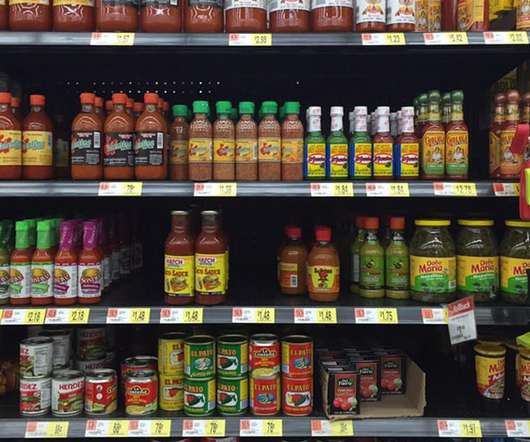
Until recently, the supply chains for CPG companies used to end with their distribution centers (DCs) serving Walmart DCs. The demand from a Walmart DC or another retailer’s DC was lumpy by definition. At most, account teams have provided a monthly forecast to demand planners and measured performance against it.
Until recently, the supply chains for CPG companies used to end with their distribution centers (DCs) serving Walmart DCs. The demand from a Walmart DC or another retailer’s DC was lumpy by definition. At most, account teams have provided a monthly forecast to demand planners and measured performance against it.
Just one Walmart DC is one million square feet, so it can be tough making sure all products are where they need to be. An ice storm may cause delays in your shipping so that your product doesn’t reach the stores on time from the DC, or your buyer may decide to run a sale, or your new marketing campaign did much better than expected.
From automated Monday morning recaps to a customizable report builder with over 5,000 key Target metrics, SOLYS by Crisp streamlines operations and drives growth for vendors in their Target partnership. Department 49: Personal Care); select classes within departments; and/or select from over 5,000 additional metrics.
Brands don’t need to hold the inventory, may not need to arrange transportation and don’t need to forecast for that subset of products. Products are stored in a domestic warehouse before being shipped on to the retailer’s DC. This takes time but can help organizations plan and forecast demand from multiple origins.
They are forecast to grow 2.5% Leverage Advanced Demand Forecasting Across the Network. One of the essential features of freight analytics is how it impacts forecasting services. Predictive planning and forecasting are easier with advanced analytics and strong data visualization. to 3% throughout the year.
This, too, is easily rectified with accurate demand forecasting. Customer demand is a dynamic metric, which means that you need to keep estimating it based on evolving market forces such as customer preferences, weather changes, and changing industry trends. Accurate demand forecasting.
General warehouse industry statistics Warehousing costs & revenue statistics Warehouse efficiency statistics Labor statistics in the warehousing industry Automation adoption in the warehousing industry Warehouse performance metrics Warehouse automation stats: General warehouse industry statistics 1. According to data from the U.S.
Retailer POS (sell-through), retailer DC inventory and retailer orders coming to the Valvoline DCs inform a dashboard Eric can pull up “to get an overall understanding of what things look like.” All this is done through management by exception at the store, DC and product level. Becoming more proactive.
Aggregate Forecast: A sales forecast for a collection of product families or individual products. Aggregate forecasts are typically stated in terms of dollars, units, or both, and are used in production, sales, and operations planning. Demand Forecast. See Forecast Demand. Demand Driven Supply Chains.
Channel Performance in Walmart Luminate is intended to act as your single-source of truth for sales, inventory and forecast data. And the range of new metrics — such as category level insights in Shopper Behavior — give you considerable visibility into your brand’s performance against competitors.
They consider factors like demand forecasts, inventory levels, and production capacities to create efficient production and distribution plans. DC Distribution Centre – A warehouse facility that stores and distributes products to retailers, wholesalers, or directly to consumers.
” Bryan adds that, “We also lacked clear visibility into inventory levels across distribution centers (DCs), and had to forecast orders based on outdated information.” Meijer: Entering this new Midwest market proved incredibly successful, seeing a 696% surge in sales growth , with Illinois’s ROM DC up 106%.
With the automation of various tasks and several risk forecasting and predicting techniques being used across several areas, logistics management sees a massive shift in the coming few years. Forecasting A Logistics Management Software that is proficient in forecasting is the ideal choice for most organizations.
Check out To DC Or Not To DC? As I came onboard I quickly gathered all of the data I could to help me understand the financial status and forecast for each facility, as well as an overview of the site capabilities, operating performance, customers, and organization structure. Benchmark metrics (eg. Subscribe Here!
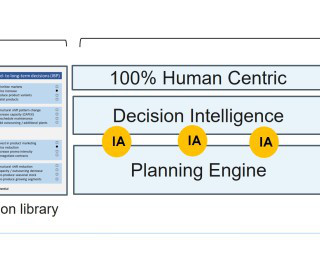
In my presentation at the 2021 International Symposium on Forecasting (ISF), I then combined decision types with augmentation and automation efficacy as per figure 4 (which I would also slightly change now: I would add augmented analytics, which is more applicable for strategic decisions than decision augmentation).
By combining Luminate Commerce’s intelligent sourcing capabilities with its stock-out forecasting capability, Forrester estimates that retailers can realize a $15.3 We wanted to see inventory positions around the world compared to our forecast, compared to our actual demand.
Forecast demand better. It makes sense to run reverse logistics as a profit centre with corresponding KPI and metrics. Recent survey information from magazine DC VELOCITY suggests that supply chains are moving towards omnichannel mostly to increase sales, market share, and customer loyalty. Speed will be an important factor.
The answer lies using these omnichannel supply chain metrics to carefully track and improve operations continuously. This is a simple key performance indicator (KPI), another name for metrics, to track. If vendors fall behind on this metric, you may need to re-evaluate your partnerships or expand your list of approved vendors.
“Hire an experienced supply chain manager…” Technology, metrics and systems are crucial, but the importance of experienced leadership and a clarified expectation for operational excellence cannot be overstated. Safety stock is a dynamic not fixed and should change based on forecast. How to optimize stock? Warehousing.
The constant change in the marketplace makes business forecasts difficult for third-party logistics service providers (3PLs). On the other hand, when in transit from factory to distribution centre, or DC to retail outlet, the enemies of food companies are not so much each other, but rather costs, delays, and risk. Business continuity.
The constant change in the marketplace makes business forecasts difficult for third-party logistics service providers (3PLs). On the other hand, when in transit from factory to distribution centre, or DC to retail outlet, the enemies of food companies are not so much each other, but rather costs, delays, and risk. Business continuity.
It spends another week getting through a regional DC network, put away, and only then is ready for picking and distribution to retail stores. Stores monitor customer purchase patterns in real-time and incorporate the data into demand forecasting and replenishment schedules.
We organize all of the trending information in your field so you don't have to. Join 102,000+ users and stay up to date on the latest articles your peers are reading.
You know about us, now we want to get to know you!
Let's personalize your content
Let's get even more personalized
We recognize your account from another site in our network, please click 'Send Email' below to continue with verifying your account and setting a password.


Let's personalize your content