This site uses cookies to improve your experience. To help us insure we adhere to various privacy regulations, please select your country/region of residence. If you do not select a country, we will assume you are from the United States. Select your Cookie Settings or view our Privacy Policy and Terms of Use.
Cookie Settings
Cookies and similar technologies are used on this website for proper function of the website, for tracking performance analytics and for marketing purposes. We and some of our third-party providers may use cookie data for various purposes. Please review the cookie settings below and choose your preference.
Used for the proper function of the website
Used for monitoring website traffic and interactions
Cookie Settings
Cookies and similar technologies are used on this website for proper function of the website, for tracking performance analytics and for marketing purposes. We and some of our third-party providers may use cookie data for various purposes. Please review the cookie settings below and choose your preference.
Strictly Necessary: Used for the proper function of the website
Performance/Analytics: Used for monitoring website traffic and interactions
In business, and the supply chain realm, no other success metric has this clarity. The post No Industry Has A Better Success Metric than Baseball appeared first on Logistics Viewpoints. The Wins Above Replacement Value tells a team exactly what they need to do to succeed.
The logistics and supply chain industry is a critical component of global trade, responsible for moving goods and materials efficiently to meet consumer and business demands. The industry’s dependency on traditional energy sources necessitates an urgent shift toward cleaner alternatives.
Creating a data-driven supply chain tracking important transportation metrics helps shippers respond and adapt as quickly as possible to known and unknown events. Why Monitor Transportation Metrics. Transportation metrics provide visibility that helps drive operative and competitive advantages.
Yet in EY’s research, they report that “nearly all supply chain leaders (97%) say that their organizations are currently facing challenges as it relates to supply chain metrics and that challenges come from a lack of integrated data and cross-functional metrics being in conflict with each other, among others.
Multiple industry studies confirm that regardless of industry, revenue, or company size, poor data quality is an epidemic for marketing teams. This buyers guide will cover: Review of important terminology, metrics, and pricing models related to database management projects.
Despite the evolution of technology, none of the 28 industry segments I follow can drive improvement at the intersection of operating margin and inventory turns. The industry is full of experts. I think that the answer has five parts: The Belief that the Industry Has Best Practices. The industry is not clear on desired outcomes.
Samuel Parker and Joe Lynch discuss DAT iQ: the metrics that matter. Shippers, brokers, carriers, news organizations and industry analysts rely on DAT for trends and data insights based on a database of $150 billion in annual market transactions. Source capacity with precision using supply and demand metrics and forecasts.
A lack of standardized ESG metrics across industries and regions makes it challenging to consistently evaluate and compare supplier performance. Finally, companies are focusing on linking ESG outcomes such as emissions reductions, labor practice improvements, or waste minimization to measurable operational and business metrics.
Partnering with NGOs, governments, and industry peers allows organizations to share resources, reduce costs, and amplify the impact of sustainability initiatives. Industry leaders must navigate these intersections carefully, balancing priorities and stakeholder expectations to achieve the most significant impact.
Just by embedding analytics, application owners can charge 24% more for their product. How much value could you add? This framework explains how application enhancements can extend your product offerings. Brought to you by Logi Analytics.
Shippers, brokers, carriers, news organizations and industry analysts rely on DAT for trends and data insights based on a database of $150 billion in annual market transactions. He is responsible for driving strategy, customer engagement, and industry analysis.
The Supply Chains to Admire report measures progress of a company within an industry peer group for the past decade. For 80% of industries, the supply chain metrics represent more than 40% impact on value. Today, companies measure too many metrics without a clear definition of value. Let’s have an honest discussion.
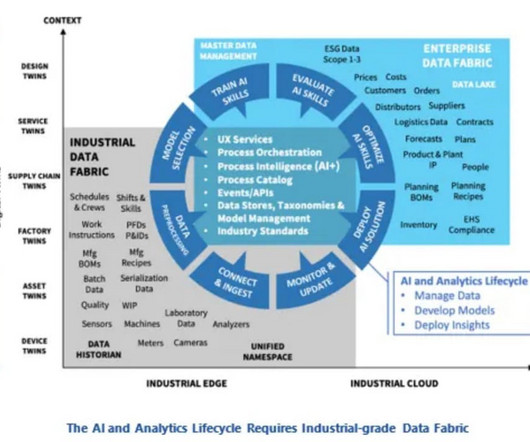
Mr. Masson recently wrote the report “ Industrial-grade AI: Transforming Data into Insights and Outcomes.” Mr. Masson leads ARC’s research on industrial AI and data fabrics. However, existing enterprise data fabrics may not be “industrial grade” enough for many AI use cases. This is why data fabrics are necessary.
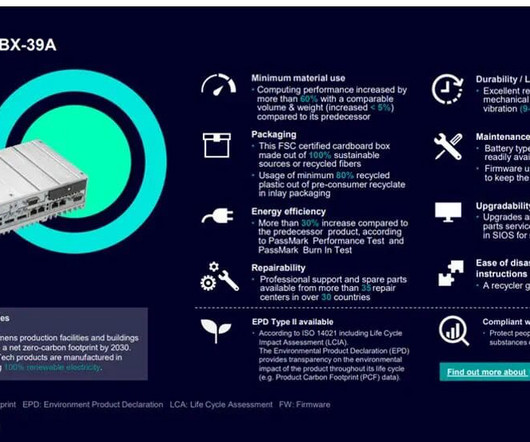
It provides customers with auditable data, sustainable achievement metrics, such as energy efficiency, and useful information that can be used for product comparison. The post Siemens EcoTech: Driving Sustainable Transformation of Industry appeared first on Logistics Viewpoints.
He is focused on revolutionizing the 3PL industry by providing innovative solutions that enable third-party logistics providers to increase their profitability and efficiency. By improving how 3PLs operate, Joshua aims to create lasting change within the industry, raising the standard for fulfillment services across the board.
As industries evolve and global markets expand, ethical considerations have become central to supply chain compliance. Public Reporting: Publishing sustainability reports and ethical compliance metrics to highlight progress and areas of improvement.
In most industries, supply chains have become increasingly complex. Built-In Sustainability Reporting Some orchestration tools are adding carbon tracking or energy use metrics alongside cost and delivery performance data. Businesses are now managing goods and information across multiple locations, time zones, and partner networks.
At each company, there is a relationship between the metrics of growth, margin, inventory, customer service, and asset strategy. For the purpose of this article, I will use Return on Invested Capital (ROIC) as the proxy metric to discuss asset utilization.) I thought that the industry averages were fairly constant. A Case Study.
Industry 4.0. The issue is that when companies optimize functional metrics, they throw the supply chain out of balance and sub-optimize value. The problem is that the industry is applying new techniques to the existing planning taxonomy without embracing the opportunity. Drip Big Data. The Connected Supply Chain.
A disruption at any point in the global logistics network including the average of 12 touch points from shipment packaging to final delivery can prove disastrous for profits, service levels, customer loyalty, and other key metrics. About the Author Terence Leung is Global Senior Director of Solution and Industry Marketing at Blue Yonder.
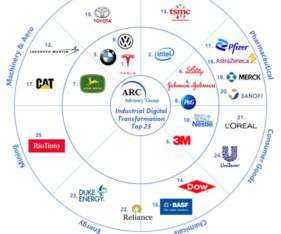
ARC’s Industrial Digital Transformation Top 25. The ARC Industrial Digital Transformation Top 25 report highlights the leading manufacturers that excel at integrating digital technology into all areas of their business, fundamentally changing the way they operate and deliver value to customers. The second is sustainability.
billion rate data points monthly to provide the most comprehensive view of the market, helping you identify savings opportunities and make data-driven decisions.
This integration includes tracking individual components and collecting data on environmental impact, including sustainability metrics such as carbon footprint and recyclability. Tracking key performance metrics and conducting regular audits help identify areas for improvement and ensure ongoing compliance with regulatory requirements.
Setting the Stage The National Retail Federation’s 2025 conference has unveiled a clear vision of retail’s future, where artificial intelligence, integrated planning solutions, and customer-centric approaches are reshaping the industry landscape. Here are the key insights we gathered firsthand at this year’s event.
As companies across industries have discovered, a well-optimized supply chain can drive significant improvements throughout their operations. We’ll examine the key components of efficient supply chains, explore essential performance metrics, and uncover the fundamental drivers that influence efficiency.
Orbit Chart for Henkel versus Consumer Non-Durable Industry for the Period of 2010-2019. Pre-pandemic performance across industries was worse than the performance pre-recession. ” I grow weary of industry doubletalk and over-used superlatives. Henkel is underperforming its peer group. What can we learn?
While the industry is flush with terms like digital twin and what-if modeling, current applications were not equal to the need. Most of the industry makes most of the visibility solutions from third-party logistics providers and technologists obsolete. Watermelon Metrics Don’t Drive The Right Results. Next Steps.
Despite goals to improve agility and resiliency, functional metrics for manufacturing efficiency continually throw the supply chain out of balance. The analysis includes over 700 companies across 28 industry sectors. Shown in Table 1 are the averages in the process industry. Sector Averages in the Process Industry.
The industry struggles with groupthink. The industry is awash with ex-execs advising companies, speaking at events, and consulting. They are unconscious that they are underperforming their peer group and have not driven industry improvement. The group’s response is, “Are these supply chain metrics?”
According to a survey by ARC Advisory Group, only 10% of industrial companies are ready to apply artificial intelligence/machine learning. The percentage of industrial companies broadly applying agentic AI and generative AI would be a small fraction of that number. ARC has been actively studying industrial AI for over two years.
One of my stark realizations this year is that smaller companies are beating larger and often more established companies on growth metrics, inventory turns, operating margin, and Return on Invested Capital (ROIC). (In The metrics selection resulted from work with Arizona State University in 2013.) Look for the full report next week.).
This is made most glaringly apparent in the fast fashion industry. In some industries, like electronics, legislation is requiring that electronic waste be reduced. Despite legislation, in 2022, the world generated 62 million metric tons of e-waste, according to the United Nations Global E-waste Monitor.
We talk about the move from functional metrics to a balanced scorecard, but we don’t use a balanced scorecard as an objective function. But lowering the costs in operations does not translate to margin, and with the volatility in the markets as shown in the industry patterns below, can we afford to only rely on enterprise data?
The use of orbit charts allowed me to see the patterns of performance at the intersection of metrics over time. Lenovo posts a 2% average margin compared to the industry average of 6%. The Company drove a pattern of improvement year over-year surpassing the industry in the 2019-2020 period. but declining. The secret?
How do we design work systems to align organizations and ensure that there is the right balance of reward systems with metrics? Is there a need to redesign metrics to move from a functional and traditional function to drive goal alignment? In the design of the digital program, spend time on metrics and reward systems.
How are companies rethinking their liquidity management strategies in response to the recent degradation across major working capital metrics? In the wake of economic uncertainty, many companies have experienced a degradation in key working capital metrics.
Protecting sensitive data—such as vehicle locations, driver information, and operational metrics—requires rigorous cybersecurity measures. Additionally, the increased connectivity that enables real-time data transmission also raises cybersecurity risks.
Cash-to-Cash Metrics. Cash-to-cash is a compound metric: (Days of Receivables+Days of Inventory)-Days of Payables=Cash Conversion Cycle. The impact of the elongation of payables on receivables varies by industry, but on average across the industries increased eighteen days when comparing the past five years to the pre-recession years.
How aligned do you believe your organization is to drive these metrics? It preceded the crazy M&A activity in the process industries. The work on the correlation of supply chain metrics to Market Capitalization demonstrates the importance of the management of margin (not costs) against inventory turns. Were they used?
Smaller, more agile companies outperform the larger and well-known brands in the retail, beverages, food, and pharmaceutical industry sectors. Industry-by-industry, I compiled data for the period of 2010-2018. The study of improvement and performance for the 535 companies in 26 industries took two months. Target Setting.
The formula for OTIF is: Measuring a supply chain against OTIF metrics is a key strategy that helps decision makers attach a tangible value to the success of their fulfillment and allows them to determine key strategies. The question then becomes what is a good OTIF score to shoot for?
The retail industry is rich with data. Price index and price elasticity are useful metrics on their own, and a combination of these can help determine the right price point to maximize revenue and profit. However, using metrics that can be easily tracked and updated is recommended. Asena holds B.S.
billion rate data points monthly to provide the most comprehensive view of the market, helping you identify savings opportunities and make data-driven decisions.
We organize all of the trending information in your field so you don't have to. Join 102,000+ users and stay up to date on the latest articles your peers are reading.
You know about us, now we want to get to know you!
Let's personalize your content
Let's get even more personalized
We recognize your account from another site in our network, please click 'Send Email' below to continue with verifying your account and setting a password.


Let's personalize your content