This site uses cookies to improve your experience. To help us insure we adhere to various privacy regulations, please select your country/region of residence. If you do not select a country, we will assume you are from the United States. Select your Cookie Settings or view our Privacy Policy and Terms of Use.
Cookie Settings
Cookies and similar technologies are used on this website for proper function of the website, for tracking performance analytics and for marketing purposes. We and some of our third-party providers may use cookie data for various purposes. Please review the cookie settings below and choose your preference.
Used for the proper function of the website
Used for monitoring website traffic and interactions
Cookie Settings
Cookies and similar technologies are used on this website for proper function of the website, for tracking performance analytics and for marketing purposes. We and some of our third-party providers may use cookie data for various purposes. Please review the cookie settings below and choose your preference.
Strictly Necessary: Used for the proper function of the website
Performance/Analytics: Used for monitoring website traffic and interactions
Introduction Gardner, (1954) and Huntzinger, (2007) define Purchase price variance (PPV) as a metric used to measure the effectiveness of cost-saving efforts by calculating the difference between the planned cost (standard pricing) allocated for purchasing activities and the actual cost incurred. worry no more! References Garnder, S.
The supply chain is a complex system with finite, and non-linear relationships between supply chain metrics that drive balance sheet results. We find that companies can improve one, but not two of the metrics. Teams struggle to drive improvement in both metrics at the same time. The period of 2007-2008 was the great recession.
Orchestration enables companies to effectively manage trade-offs between source, make, deliver and sell.) Industries carried on average 32 days more inventory in 2020 than in 2007. (I Organizations can align to drive value despite the allegiance to functional metrics. We source this data from Y charts. Mistake #5.
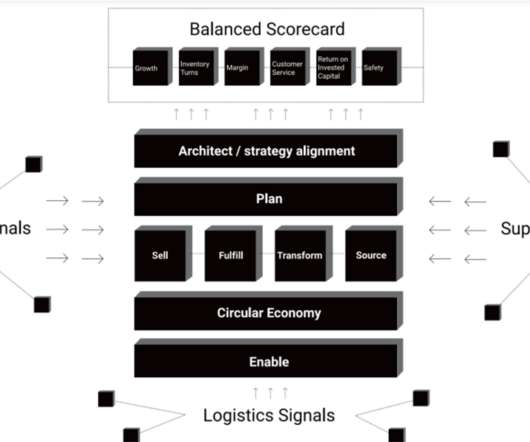
No metric should be measured in isolation, and functional metrics should be replaced with the balanced scorecard metrics shown in Figure 2. To maximize value—price to tangible book, functional metrics need to be reset to focus on reliability. 5 A Focus on Functional Metrics Throws the Supply Chain Out of Balance.
Over the period of 2009-2015, only 88% of companies made improvement on the Supply Chain Metrics That Matter. To meet the criteria for The Supply Chains to Admire for 2016, companies needed to score better than their peer group average for performance metrics, while driving a higher level of improvement than 2/3 of their industry peer group.
The winners drive improvement while posting financial results in the Supply Chain Metrics That Matter ahead of the peer group. The performance factors evaluated in the analysis are: Growth. (If you trace the year-over-year pattern, you can see that P&G made progress on inventory turns and operating margin 2006-2007, 2009-2010.
A Demand-Driven Value Network as defined by AMR Research in 2007: A network that senses demand with minimal latency to drive a near real-time response to shape and translate demand. Lora has written the books Supply Chain Metrics That Matter and Bricks Matter , and is writing her third book, Leadership Matters.
In 2007-2014 Terra added inventory management, multi-tier demand sensing, transportation forecasting, and long-term forecasting. There is greater dependency on third parties for manufacturing and sourcing. Likewise, the Terra Technology team will need to learn sourcing. The Company has a checkered past.
When I was an analyst at AMR Research in 2007, I tracked thirty. With cloud-based analytics, non-relational database open source code sharing and advancements in predictive, prescriptive and cognitive analytics, what is old, can become new again. The market of Supply Chain Operating Networks consolidated. Today, there are a handful.
Recent studies have shown that transportation is the single largest source of greenhouse gas emissions in the United States. In 2007, the U.S. Department of Energy calculated that CO2 emissions from transportation surpassed two billion metric tons ; it’s hard to imagine what that number looks like today.
Before 2007], modern smartphones did not exist. Missed opportunities are another equal source of extraordinary risk. For organizations layered in functional metrics and driving a cost agenda, this is a tough nut to crack. Today more than half of the people on the planet carry one. Tougher than most understand.”[6]
While traditional supply chain processes evolved from functional excellence definitions for source, make and deliver from the inside-out; to make the digital pivot and become more market-driven, companies need to define new supply chain processes outside-in. For example, in the recession of 2007, DuPont missed the downturn in the market.
I remember December 2007 like yesterday. There is more in-transit inventory–sitting on the water in larger ships, in-transit through international sourcing strategies, or work with contract manufacturers–as a result, to avoid inventory write-offs, the foot needs to hit the brake faster. They are not. Reflection.
The only real problems they had outside of vying with their competitors were helping their accounting folks in the home office locate the source of deductions that were not obviously linked to the promotion plans; and heck, that wasn’t their problem anyway, right? It was a tedious effort, but, overall, rather easy. Ah, those were the days!
Such systems are also instrumental in establishing aligned tactical and strategic performance metrics systems that drive improved economic outcomes (Bendoly et al., Emerging Issues in Supply Chain ERP Systems Strategic Sourcing Supplier Relationship Management Supply chain analytics Supply Chain Management Supply Chain Systems'
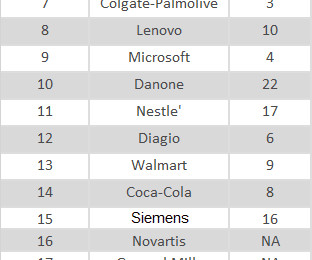
Many metrics can be used to determine the top 3PL warehousing companies, such as company revenue, the number of warehouses, total warehouse square footage , etc. This compilation is based on the most currently available company revenue data (between 2018 and 2020) without factoring in any other metric. Revenue: $8.17
.” A question came from the audience: “Fundamentally – procurement is measured on cost savings as the primary metric. Other metrics are whether you agree off of purchasing agreements in the company, and some customer satisfaction metrics – and are internal stakeholders satisfied. In 2007, Apple launched the I-Phone.
By having many service providers involved, which among each other are often not connected, the friction in moving goods from source to destination are very high. metrics that really impact the bottom line; the Leaders in our survey. ► 2007. (4). Subscribe To. Friday, 7 December 2012. Supply chain Leaders. impressive 15.3
During supplier selection, companies should apply appropriate procedures and use suitable metrics to select suppliers that align with the company’s ESG policies and broader values. Businesses that hold too much inventory needlessly use resources to source, produce, store, and transport items that might not even be sold.
It was the world’s largest VC firm in 2007 with over $20 million in assets during the year. Product sourcing. Product sourcing is the process of purchasing or creating products that you can sell. A thorough understanding of metrics that prove out business models. New Enterprise Associates is an American-based VC firm.
Supply chain resilience generally means the ability to manage risk and be best positioned to respond and even gain advantage from disruptions (Sheffi, 2007). [1] Example: Considering the long-term investment in capital and manpower to mine rare earth elements from domestic or intra-continental sources.
Going by that metric, truck drivers and material moving occupations are at the top of the list, with 1,388 fatal injuries in 2016, according to recent data compiled by the Bureau of Labor Statistics. One of the most common ways to measure the dangerousness of an occupation is by the total number of fatalities in a year. Media Caption.
These alliances are: Source: Transplace. During the Great Recession of 2007-2009, demand decreased rapidly for container shipping, causing a chain reaction for carriers. But why the need for alliances at all? The answer lies in the state of the ocean container shipping industry over the past ten years. back to Asia).
Before boarding the plane, I watched a traveler pull a diet Coke from the bin and thought about the struggle to source sweetener with the rise of COV-19. As I poured the dog food into the bowl for my pups, I wondered if I was going to have to switch kibble due to the looming issues of sourcing taurine—a health additive in many pet foods.
Abby and I are writing an e-book on Supply Chain Metrics that Matter. Likewise, in today’s supply chain environment, I find that supply chain leaders favor a single function of logistics, manufacturing or sourcing. Companies that are not looking holistically at metrics are stuck. It will publish in the early summer.
Van Gundy believes the corporate landscape is different from what it was in the early 2000s and during the Great Recession of 2007-2008. Where in the past they might have focused primarily on days payable outstanding (DPO) as a financial metric, they’re now giving equal attention to days sales outstanding (DSO) and inventory levels.
According to Supply Chain Dive , “ Cost-cutting has become a major focus for the agency, which has posted $87 billion in losses from fiscal years 2007 through 2020. ” The refinery also will be powered by the MidAmerican Energy electrical grid, which is made up of more than 88% renewable sources. million metric tons. .
Seasoned supply chain professionals used the mental model from the recession of 2007 as a guidepost.) Planning taxonomies change to enable the trade-offs between source, make and deliver based on market signals and the design of supply chain flows to enable this shift. These concepts are new. Unlearning needs to proceed testing.
Work with support sources that can significantly contribute to the planning, training and implementation processes at a systems level. In comparison, in 2000-2007 the U.S. Financial performance metrics are valuable as they capture the economic consequences of business decisions. locations to be in close proximity to the U.S.
In comparison, in 2000-2007 the U.S. Financial performance metrics are valuable as they capture the economic consequences of business decisions. Where is the metric for determining the sources and uses of cash from three perspectives - operational, investment and financial? Good advice from Drewry.
In comparison, in 2000-2007 the U.S. Financial performance metrics are valuable as they capture the economic consequences of business decisions. Where is the metric for determining the sources and uses of cash from three perspectives - operational, investment and financial? locations to be in close proximity to the U.S.
In comparison, in 2000-2007 the U.S. Financial performance metrics are valuable as they capture the economic consequences of business decisions. Where is the metric for determining the sources and uses of cash from three perspectives - operational, investment and financial? locations to be in close proximity to the U.S.
The trade war is likely to extend the for-hire freight recession further as higher prices reduce goods affordability and consumers’ real incomes.” ( See More Below) CATEGORY SPONSOR: SOFTEON Each month, Cass nicely summarizes the state of freight, as seen in the graphic below for May: Source: Cass An y reaction to thi s Cass report?
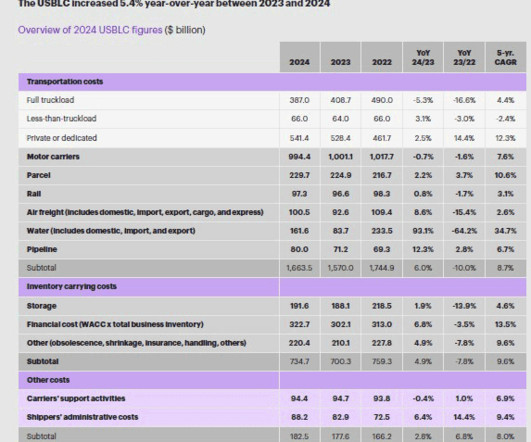
You can find the full breakdown by logistics cost bucket in the chart below: Source: CSCMP/Kearney Within transportation, trucking-related spend (including private fleets but excluding parcel) comprised 59.7% In comparison, in 2000-2007 the U.S. of the total cost logistics number (versus 7.2% of total transport costs and 38.5%
In comparison, in 2000-2007 the U.S. Financial performance metrics are valuable as they capture the economic consequences of business decisions. Where is the metric for determining the sources and uses of cash from three perspectives - operational, investment and financial? locations to be in close proximity to the U.S.
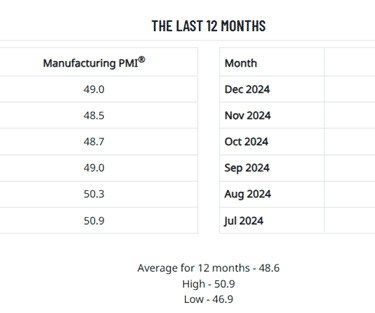
Source: ISM However, of the 18 sectors tracked by ISM, 9 reported growth in June. In comparison, in 2000-2007 the U.S. Financial performance metrics are valuable as they capture the economic consequences of business decisions. It is now averaging just 48.6 over the past year. locations to be in close proximity to the U.S.
In comparison, in 2000-2007 the U.S. Financial performance metrics are valuable as they capture the economic consequences of business decisions. Where is the metric for determining the sources and uses of cash from three perspectives - operational, investment and financial? locations to be in close proximity to the U.S.
In comparison, in 2000-2007 the U.S. Financial performance metrics are valuable as they capture the economic consequences of business decisions. Where is the metric for determining the sources and uses of cash from three perspectives - operational, investment and financial? locations to be in close proximity to the U.S.
Source: State of Logstics Report 2025 May you live in interesting times, as the Chinese saying goes. In comparison, in 2000-2007 the U.S. Financial performance metrics are valuable as they capture the economic consequences of business decisions. Any F eedback on our Supply Chain Graphic of the Week?
In comparison, in 2000-2007 the U.S. Financial performance metrics are valuable as they capture the economic consequences of business decisions. Where is the metric for determining the sources and uses of cash from three perspectives - operational, investment and financial? locations to be in close proximity to the U.S.
We organize all of the trending information in your field so you don't have to. Join 102,000+ users and stay up to date on the latest articles your peers are reading.
You know about us, now we want to get to know you!
Let's personalize your content
Let's get even more personalized
We recognize your account from another site in our network, please click 'Send Email' below to continue with verifying your account and setting a password.


Let's personalize your content