Remove 2019 Remove Manufacturing Procurement Remove North America Remove Transportation
article thumbnail

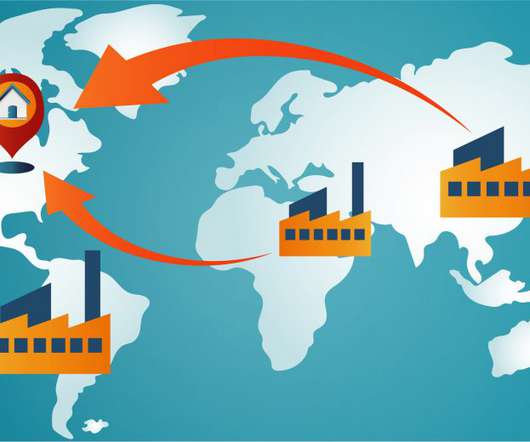
Bringing It All Back Home – OTR TMS Supports Reversion to Regional Manufacturing

Supply Chain Collaborator

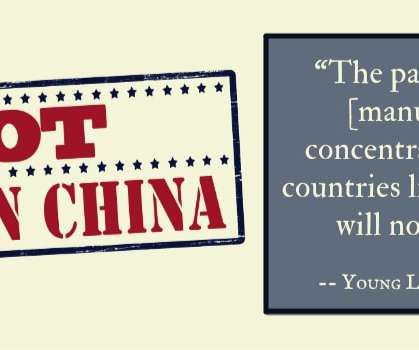
Will the trend toward a return to “regional manufacturing” boost volumes in over the road transportation in North America as manufacturers move away from Asian overseas operations? Transportation logistics software solutions play a key role in effectuating this change.

article thumbnail

Seven Mistakes You Wish Your CFO Had Not Made You Make

Supply Chain Shaman

To understand the phenomenon , the 2019 GDP was 2.16%. Overall lead times from North America to Asia took 17 days longer than from Asia to North America, or 25% longer. Source E2open Shipping Index). The Chief Financial Officer gained more presence with procurement and IT reporting to finance.

Insiders

Sign Up for our Newsletter

This site is protected by reCAPTCHA and the Google Privacy Policy and Terms of Service apply.

article thumbnail

Seven Mistakes You Wish Your CFO Had Not Made You Make

Supply Chain Shaman

To understand the phenomenon , the 2019 GDP was 2.16%. Overall lead times from North America to Asia took 17 days longer than from Asia to North America, or 25% longer. Source E2open Shipping Index). The Chief Financial Officer gained more presence with procurement and IT reporting to finance.

article thumbnail

Global Manufacturing Activity Levels Stabilize in February

Supply Chain Matters

Global Manufacturing Activity Levels Global manufacturing activity as reported by the J.P. Morgan Manufacturing PMI® , compiled by S&P Global in association with ISM and IFPSM , halted a consecutive five-months of contraction levels to that of no-change. The S&P Global US Manufacturing PMI® had a February value of 47.3,

article thumbnail

Scenario Modeling Is Now Crucial for Supply Chain Network Design

AIMMS

Our 2018- 2019 Network Design Survey showed that the majority of organizations are still relying on spreadsheets (nearly 60%) and gut feel (15%) to make network design decisions. They were able to take variable costs, fixed costs, transport costs, different transport types and many other options into account. .

Modeling 361
article thumbnail

PepsiCo’s Massive, Complex, and Difficult Greenhouse Gas Initiative

Logistics Viewpoints

294 manufacturing facilities produced more than 90 million metric tons of food and beverage in 2021. But in North America, distribution is predominately through their company-owned fleet. There are continuing efforts to reduce the weight of their tractor and trailers in North America.

article thumbnail

Top 20 Warehouse Automation Suppliers Worldwide

Logistics Viewpoints

billion in 2019. Fast forward 5 years, and ARC’s 2019 base-year study estimated the market at $11.9 Also, warehouse automation excludes similar systems such as airport baggage handling, manufacturing-line automation, and manually driven forklifts. Looking back, I estimated the market in 2013 at $6.4 Well, I am saying it.