This site uses cookies to improve your experience. To help us insure we adhere to various privacy regulations, please select your country/region of residence. If you do not select a country, we will assume you are from the United States. Select your Cookie Settings or view our Privacy Policy and Terms of Use.
Cookie Settings
Cookies and similar technologies are used on this website for proper function of the website, for tracking performance analytics and for marketing purposes. We and some of our third-party providers may use cookie data for various purposes. Please review the cookie settings below and choose your preference.
Used for the proper function of the website
Used for monitoring website traffic and interactions
Cookie Settings
Cookies and similar technologies are used on this website for proper function of the website, for tracking performance analytics and for marketing purposes. We and some of our third-party providers may use cookie data for various purposes. Please review the cookie settings below and choose your preference.
Strictly Necessary: Used for the proper function of the website
Performance/Analytics: Used for monitoring website traffic and interactions
Supply chain excellence is easier to say than to explain. At each company, there is a relationship between the metrics of growth, margin, inventory, customer service, and asset strategy. For the purpose of this article, I will use Return on Invested Capital (ROIC) as the proxy metric to discuss asset utilization.) The reason?
The award, based on beating the industry peer group on rate of improvement on the key metrics of growth, operating margin, inventory turns, and Return on Invested Capital (ROIC) while outperforming their peer group, is tough to achieve. The orbit chart below illustrates L’Oréal’s performance at the intersection of two metrics.
Introduction Gardner, (1954) and Huntzinger, (2007) define Purchase price variance (PPV) as a metric used to measure the effectiveness of cost-saving efforts by calculating the difference between the planned cost (standard pricing) allocated for purchasing activities and the actual cost incurred.
Ed argued that instead of buying new packaging equipment that we should work with R&D to have a base flavor and add the color and flavoring at the head of the machine. Despite goals to improve agility and resiliency, functional metrics for manufacturing efficiency continually throw the supply chain out of balance. The So What?
This team is not buying the message. So much so, that three years ago, I founded a research company to focus on understanding supply chain excellence. When we started benchmarking companies, Deborah and I had a friendly wager. Deborah and I benchmarked 97 supply chains; and, we found the inverse to be true. I was wrong.
While there is work within SAP to rethink SNC and use the assets purchased with Ariba to build multi-tier capabilities, the progress is not encouraging. the company is owned today by 20 organizations representing manufacturers, distributors, hospitals and group purchasing organizations (GPOs). Marketplace Rebirth.
Think of them as apples and gearseach essential and effective on its own, yet when combined; they create a formidable mechanism for achieving procurement excellence. However, they create an unbeatable duo for procurement excellence. PwC, “Procurement Performance Benchmarking,” 2023.
There is an inverse relationship between margin and supply chain excellence. Zimmer’s strategic framework focuses on growth, operational excellence and prudent capital allocation. Leaders need to start a system to improve measurement and tie performance to buying incentives. I don’t think so. It matters more. My Challenge.
Organizations then convert those demand forecasts to the associated quantities of raw materials to purchase, goods to be manufactured, or finished products to ship. It is important to benchmark forecast accuracy and similar supply chain metrics against your peers.
I have learned that supply chain systems are more complex than I originally thought, and that the relationships between supply chain metrics are nonlinear. I would build an expertise system in the Supply Chain Center of Excellence. After three years of research, I have just refined the methodology to start to pull the trends.
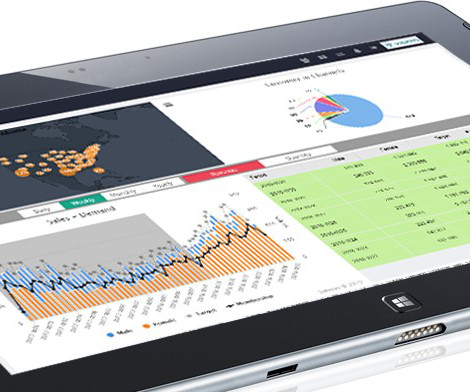
Modern platforms pull data from a wide array of sources: ERPs, relational databases, Excel files, cloud apps, third-party providers, and beyond. Packaged Analytics, KPIs & Reports Ready-to-use reports, metrics, and dashboards that accelerate time-to-insight. They served a purpose but lacked flexibility and real-time relevance.
However, none of the three companies knew this before the benchmarking activity. This includes the automation of path-to-purchase for consumer products, active shaping of demand through price, channel incentives and promotions, eCouponing and mobile commerce for retail, and product proliferation for all. It constantly amazes me.
You’ll note in the headline I use the preposition “of” instead of “to” when describing the “journey of Supply Chain Excellence.” The differentiator is whether Supply Chain Excellence is defined as a one-time project or as on ongoing process. Circuit City failed to adapt and is now history.
This morning, unexpectedly, I found myself in the middle of a debate between my two panelists on the Planning Benchmarking Panel for the Summit. Recently through my analysis of the planning benchmarking work, I have become fascinated on the role of inventory in the market-driven value network. This is a series of preparation calls.
The network senses, translates, and orchestrates market changes (buy- and sell-side markets) bidirectionally with near real-time data to align sell, deliver, make and sourcing organizations outside-in. The translation of independent demand into cycle stock reduction in production planning and material buying in demand-driven MRP.
Available to Promise (ATP) Available to Promise (ATP) is a real-time inventory management metric that tells you how much of a product you can promise to customers without overcommitting. Benchmark against your industry average for best insight. It supports smarter buying by showing which categories or products deliver the best ROI.
Circular Economy & Waste Minimization Procurement no longer stops at the point of purchase, it now includes end-of-life considerations. For AFFLINK’s members, the ELEVATE platform offers data-backed insights highlighting opportunities to optimize sourcing through ESG-aligned benchmarks.
Executive, after executive, lament, “They have purchased many technologies and sponsored many projects to reduce inventories, but they are not seeing results.” We are systemically evaluating each industry in the Supply Chain Insights Metrics That Matter series of reports. At Supply Chain Insights , this is our passion.
Well, I asked Steven Thacker, one of our benchmarking management experts, exactly that question! What is Benchmarking? Benchmarking is essentially comparing; comparing one against another. Those levels are “benchmarks”. Of course, benchmarks and benchmarking can cover all kinds of different things, at work or elsewhere.
Many people are talking about Key Performance Indicators, Metrics, Analytics, and other indicators of performance. The importance of selecting the right metrics or “measures” as I prefer to call them, is critical as we all know that metrics drive behaviors. Step 2 – Develop Metrics and Data Sources.
As legislation focuses ever more heavily on environmental protection though, and consumers increasingly consider sustainability in their purchasing decisions, all supply chain organisations will need to find the way forward. This is where sustainability benchmarking can really help you home in on where improvement is most needed.
If not, you might be surprised at the many ways supply chain benchmarking can be used to understand performance, identify areas for improvement and actually turn those improvements into reality. I asked Steven Thacker, one of our benchmarking management experts, to explain exactly what benchmarking is.
The team involved in the transformation includes Johnny Ivanyi, Global Head of Distribution Excellence at Bayer Crop Science and Vivek Chhaochharia, Digital Supply Chain Leader at EY US. I just had a good benchmarking discussion yesterday with a company that’s starting the journey with Blue Yonder that we began 10 years ago,” he states. “The
From the Purchase Order (PO) Status Report to the RFQ Performance Report, each report is dissected to provide a clear definition and a deeper understanding of its significance. Total Cost: The overall cost of the purchase order, calculated based on quantities and unit prices.
In the procurement phase, documentation begins with purchase orders and supplier contracts. To actively reduce manual errors and benchmark performance, SCMDOJO’s Logistics KPIs Excel Template offers a ready-to-use tool that tracks efficiency metrics directly tied to documentation quality.
I was an avid student of supply chain excellence; and in this role, I watched as best-of-breed solution after best-of-breed solution replaced with more complicated technology. In my analysis of the supply chain planning benchmarking data, I can see it. Buying patterns are changing quickly, and the insights are multi-dimensional.
The inherent buying patterns of consumers are also changing. Purchases in the center store of the grocery store are in decline, and apparel tastes are shifting. By building demand management processes to focus on channel movement, companies can cut demand latency and model independent demand–customer purchases.
As legislation focuses ever more heavily on environmental protection though, and consumers increasingly consider sustainability in their purchasing decisions, all supply chain organisations will need to find the way forward. This is where sustainability benchmarking can really help you home in on where improvement is most needed.
Speaker(s): Rob Bass, Vice President, Distribution, Best Buy Co., Learn how these retailers determine key metrics for the stores and for the Executive team, and how they measure and improve efficiency in order to better serve their customers. Achieving Supply Chain Excellence in a Dynamic Era.
However, there is a wide range of metrics that you should be tracking to help your online store grow. Why ecommerce performance metrics are important. Why are ecommerce performance metrics important to your online store? COGS = Beginning inventory + Purchases during the period – Ending inventory. Table of Contents.
This includes providing excellent customer service, so businesses can enhance customer satisfaction and loyalty. Analyze performance metrics and implement improvements to enhance efficiency. To run the department, a supply chain manager needs certain supply chain metrics and KPIs to improve performance. Enroll Now!
When customers have transparency into product availability, delivery timelines, and order status, they are more likely to complete purchases and continue shopping with a business. At the same time, it makes excellent sense to have a good SEO software solution to keep track of how your marketing strategies perform.
Benchmarks suggest routes are often 10–15% longer compared to results from platforms built for enterprise-scale complexity. Businesses looking to offer more personalized or on-brand post-purchase communication may find the system somewhat restrictive compared to more configurable alternatives.
For example, you may look after PPE and office equipment in-house but have a supplier of maintenance equipment monitor this inventory on your behalf who raises purchase orders when stocks are low. Identify identical or similar MRO inventory stock items to determine if spending can be reduced through bulk purchases.
Start by comparing your upcoming budget with past performance metrics , such as past income, expenses, and spending patterns, then analyze how the budget will perform in real-world conditions. This method is usually visualized in Excel or similar tools. Can you do budget forecasting in Excel? Do investors want to see forecasts?
As I settled into the job and started learning, and studying, the various Supply Chain metrics I was surprised when I looked at the Inventory Turnover performance of the company. First I would talk with the 3 main people in charge of the Inventory Management and Procurement buying functions within the company. There were no targets.
As legislation focuses ever more heavily on environmental protection though, and consumers increasingly consider sustainability in their purchasing decisions, all supply chain organisations will need to find the way forward. This is where sustainability benchmarking can really help you home in on where improvement is most needed.
Supplier Relationship Management is the relationship that develops between a buyer and supplier, which is subject to the exigency of the goods or services purchased and supplied to an organization and dictates the nature of the working relationship that the buyer should look to nurture with their suppliers.
I don’t for one second deny that the companies on the list have great supply chains, but there are so many advances in Supply Chain technology, talent, skills and capabilities that it is hard to believe that all of this excellence is restricted to the same group of 20 companies year after year after year. Gartner Survey Metric Notes: 1.
These tools enable organizations to quickly turn insights into actions with strong stakeholder buy-in while accelerating the execution of strategies across the business and the attainment of an organizations’ objectives. Cost Optimization Analytics can uncover inefficiencies in spending and allocate resources more effectively.
For example, a member of the sales team could apply to become a purchasing agent, based on her experience of negotiating sales deals. Track KPIs and benchmark the supply chain’s performance. Recommend ways to enhance performance metrics such as inventory, delivery, and overdue orders. Purchasing Agent. Warehouse Manager.
This blog explores the trends that define this year’s holiday season and the factors that draw the consumer path to purchase. Consumers leverage AI-powered benchmarking tools to track the price of their favorite items and make the purchase once it hits its lowest point. compared to the last year.
Create an adaptive unified buying process. “If you look at the typical buying process, it is bifurcated based on geography. If I am going to buy goods from this geography, then I use this process. At the very least, they should see a message indicating that the products are out of stock before they make the purchase.
Channel Performance in Walmart Luminate gives you a true omni-channel view of sales, whether the purchase is in-store, delivered, shipped to store, picked up, or shipped directly to the customer. This module also includes data on: switching, trial and repeat, assortment, basket, loyalty, benchmarking and more.
We organize all of the trending information in your field so you don't have to. Join 102,000+ users and stay up to date on the latest articles your peers are reading.
You know about us, now we want to get to know you!
Let's personalize your content
Let's get even more personalized
We recognize your account from another site in our network, please click 'Send Email' below to continue with verifying your account and setting a password.


Let's personalize your content