This site uses cookies to improve your experience. To help us insure we adhere to various privacy regulations, please select your country/region of residence. If you do not select a country, we will assume you are from the United States. Select your Cookie Settings or view our Privacy Policy and Terms of Use.
Cookie Settings
Cookies and similar technologies are used on this website for proper function of the website, for tracking performance analytics and for marketing purposes. We and some of our third-party providers may use cookie data for various purposes. Please review the cookie settings below and choose your preference.
Used for the proper function of the website
Used for monitoring website traffic and interactions
Cookie Settings
Cookies and similar technologies are used on this website for proper function of the website, for tracking performance analytics and for marketing purposes. We and some of our third-party providers may use cookie data for various purposes. Please review the cookie settings below and choose your preference.
Strictly Necessary: Used for the proper function of the website
Performance/Analytics: Used for monitoring website traffic and interactions
The global freight sector faces growing pressure to balance cost-efficiency with environmental responsibility. With freight transport accounting for a significant share of global emissions, efforts to improve logistics now extend beyond operational metrics to include resilience, regulatory compliance, and climate performance.
However, as carbon taxes and emissions reporting requirements continue increasing, supply chain professionals face mounting pressures from inside and outside their organizations to measure and improve performance against new, nebulous sustainability metrics. Freight transportation makes up over 10% of total global carbon emissions.
billion rate data points monthly to provide the most comprehensive view of the market, helping you identify savings opportunities and make data-driven decisions. billion rate data points monthly to provide the most comprehensive view of the market, helping you identify savings opportunities and make data-driven decisions.
Similarly, shifting freight from road to rail or waterways offers lower-emission alternatives for long-haul transport. Leaders must track and report progress using established frameworks such as the Global Reporting Initiative (GRI) or the Science-Based Targets Initiative (SBTi).
Samuel Parker and Joe Lynch discuss DAT iQ: the metrics that matter. Samuel is Director of Product Marketing at DAT Freight & Analytics ‘ Shipper segment. DAT operates the largest truckload freight marketplace in North America. Source capacity with precision using supply and demand metrics and forecasts.
billion rate data points monthly to provide the most comprehensive view of the market, helping you identify savings opportunities and make data-driven decisions. billion rate data points monthly to provide the most comprehensive view of the market, helping you identify savings opportunities and make data-driven decisions.
SCB Feature Report From DPW: What’s Next for AI in Supply Chain? AI will also come to the fore to help companies manage their carbon footprint, greenhouse gas emissions and other sustainability issues, especially reporting, Koganti said, and not least Scope 3 emissions, which are currently the bane of supply chain sustainability.
Supply chain reports offer a comprehensive view of your entire supply chain operation. What are Supply Chain Reports? Supplier Performance Evaluating supplier performance based on key metrics such as on-time delivery, quality of goods received, adherence to agreed-upon terms, and responsiveness to inquiries.
The four key methods here will help you drive more success as you bring the metrics to life on your warehouse floor: 1. Show the “story” of your metrics with quarterly and yearly growth charts; show how far you’ve come as a team over time. As a leader, you need many tools to eliminate this mindset.
Transportation metrics saw little change in May as capacity, utilization and pricing remained in expansion territory, according to a monthly survey of supply chain professionals. The report classifies a reading over 70 as “significant expansion.”) reading for transportation capacity during May, which was roughly in line with April.
In addition, shippers were responsible for the whole of their operations, ranging from carrier negotiations through freight settlement and dispute resolution practices like reverse logistics. . Opportunities to leverage network size to enable freight consolidation. Reduced risk for damage to the freight.
Transportation Metrics That Matter Most to Track and Improve Performance : How do you measure logistics efficiency and transportation metrics performance indicators when you are already doing the best job possible? To add insult to injury, they also rarely have reporting mechanisms to properly monitor those expenses.
Whether refining freight logistics efficiency at port terminals or enhancing last-mile delivery in urban neighborhoods, V2X adds intelligence to every vehicle interaction. This is a working model for connected urban freight corridors. This type of cooperative driving is ideal for long-haul logistics.
Freight Consolidation. Sometimes, the lines between FT and LTL are blurred, especially when all LTL shipments are compiled into FT via freight consolidation. Simplifies Reporting to Stakeholders. Dashboarding capabilities in the TMS allows management to compile reports and information for stakeholders more easily.
Capturing carrier data gives you more visibility into your freight spend and enables you to make data-driven decisions that positively impact your business. Download the White Paper: Over the Road Freight Management Trends. Identify and Apply Freight Consolidation Opportunities. Track Carrier Performance Data. a shipment?doesn’t
Achieving end-to-end supply chain visibility has always been (and remains) a top priority for companies, but over the past few years, the spotlight has been on a particular segment of the process: achieving real-time freight visibility. How does freight visibility impact OTIF? What’s driving this demand? What’s driving this demand?
IT hardware is non-standard freight, meaning it is difficult to move due to its size and sensitivity. The GLEC Framework is a guide for shippers, carriers, and logistics service providers on reporting emissions from logistics operations. A clear goal needs to be combined with good data and metrics.
Throughout the supply chain, the use of metrics to track and understand processes provides an invaluable resource for ensuring increased production and customer satisfaction. What Distribution Center Metrics Need Tracking? However, the most important metrics can be categorized into the following eight areas. On-Time Shipping.
To that end, every warehouse manager’s role is to manage the physical environment, loadshifting equipment and people, to decrease the chances of collision and accidents, and often, to help the flow of freight via outbound and inbound freight management; an entire process known as warehouse traffic management. Read the full Post.
Today, we kick off our annual year end series highlighting the top blog posts in each of our 7 main categories: Manufacturing , Supply Chain , Logistics , 3PL , Business , Transportation , Freight. Finally, the top 10 list was rounded out safety and metrics. These will only contain posts written in 2014. Read Full Post.
As consumer spending fell, the days of escalating ocean freight and extreme shipping variability eased this year. For organizations layered in functional metrics and driving a cost agenda, this is a tough nut to crack. If you click the link, please be assured that all responses are reported in aggregate, and the names are anonymous.
The Digital Freight Ecosystem. Part 2: What’s Bringing Freight Online. In the first part of this article , Dr. Schreiber observed that freight is still largely offline and examined why freight digitalization has been so complicated. . Bringing Freight Online In The Carrier Space. By Zvi Schreiber, CEO, Freightos.
That means identifying areas of waste, overlap and large volumes and enabling continuous improvement through the use of transportation metrics to track performance. It's the view from outside that allows 3PLs to orchestrate all aspects of freight management from within the network through transportation optimization.
This extensive connectivity has resulted in impressive metrics: 1.2 This includes resolving issues autonomously, calling carriers, rerouting freight, and executing bookings. billion shipments processed annually, a 246,000+ global carrier network, and 256+ integrations with TMS and ERP systems.
UPS is seeking alternative strategies for its truck brokerage business, which has seen sales plummet amid a freight recession marked by declining rates and over capacity. More than $728 million is on the way to communities around the nation to bolster intermodal freight infrastructure. And now on to this week’s logistics news.
Management believes that investors and financial analysts measure our business on the same basis, and we are providing the Adjusted EBITDA financial metric to assist in this evaluation and to provide a higher level of transparency into how we measure our own business. Adjustments to reconcile to Adjusted EBITDA: Interest expense 0.2
Today, we are nearing the end of the fourth quarter of corporate reporting. Self-reported projections of the ocean carriers forecast that the industry is posting over $200B in profits. Maersk, the world’s largest container shipping company, reported its best quarter in 117 years, posting a $5.9B profit for Q3 on $16.6B
If your vendors do not understand your organization’s policies and procedures regarding inbound freight , how can they adhere to your needs? This means that a near-majority of companies are faced with the pitfalls of internal, low-guidance systems for managing both inbound and outbound freight. Lack of Trading Partner Understanding.
When you choose a company to transport your freight or to supply you with the materials you need to manufacture a product, you are putting your hard work and reputation in their hands. The next posts in the series will break down metrics and issues to consider in SQM by industry and conclude with a case study on the application of SQM.
We continue our series on the top 5 blogs in our 4 main categories ( Freight , Manufacturing , Logistics , and Supply Chain ). Our first post covered the Top 5 Freight Management blogs of 2016. It was also evident that many folks wanted more information around KPIs and Metrics, as our top 5 included two posts from this sub-category.
Among the services which they provide are transportation, warehousing, cross-docking, inventory management, packaging, and freight forwarding.”. It includes brokerages and freight forwarders, but there comes a point at which simply outsourcing to a single 3PL or even several 3PLs grows too complex to handle. Billion by 2026.
For logistics teams seeking to manage volatility and deliver more predictable, profitable results, five advanced technologies should be in their toolkits: digital control towers, warehouse task automation, warehouse robotics, dynamic price discovery and digital freight bidding. Digital Freight Bidding. Warehouse Task Automation.
The Approach to Effective Freight Procurement by LSCMS Shippers’ Council Container shipping procurement faces a multitude of challenges shaped by global events, industry shifts, environmental mandates, and technological advancements. To thrive in this ever-evolving landscape, shippers must embrace a flexible and responsive approach.
Based on ARC Advisory Group’s new global market report, the three largest providers of MSCN, listed alphabetically, are Descartes, E2open, and Infor Nexus. They have a public cloud architecture and the TMS revenues are in the scope of this report; BluJay’s revenues were included in E2open’s MSCN revenues.
Whether your company is a big or small player in terms of shipping volumes, and regardless of your chosen transportation modes (road, rail, ocean, air), the health of your bottom line depends in no small part on the competitiveness of your freight prices. So how can you be sure you’re getting the best freight rates possible?
E-commerce spending will surpass $4 trillion annually by 2020, reports eFulfilmentService, accounting for approximately 15 percent of total global retail spending. Lackluster insight into freight spend and poor freight management controls. According to Webgility, these may include: Manual processes and activities.
Implementing new technology is a complicated process, but it can be simplified as follows: Integrate systems that control both inbound and outbound freight. This ensures an adequate safety stock. Focus on visibility. Visibility in the distribution center helps all parts of the supply chain function as a single unit.
The report provides a cross-industry perspective on environmental sustainability in logistics including fuel consumption, screening logistics providers, packing material, sales order delivery, and reverse logistics based on 1,157 valid participants. Below are the results from the cross-industry report for environmental sustainability.
billion rate data points monthly to provide the most comprehensive view of the market, helping you identify savings opportunities and make data-driven decisions. billion rate data points monthly to provide the most comprehensive view of the market, helping you identify savings opportunities and make data-driven decisions.
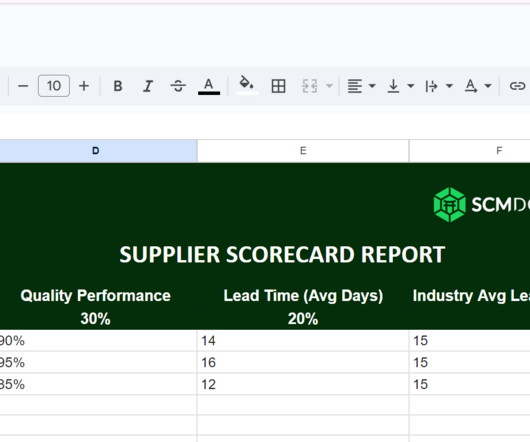
These reports are how companies like Walmart, Target, Amazon, and others track your performance as a supplier. A retailer scorecard is a performance report used by retailers to evaluate how well you’re meeting their delivery standards. Some retailers like Walmart emphasize OTIF as their core performance metric.
The European Union’s Corporate Sustainability Reporting Directive (CSRD) is leading the way, mandating emissions disclosures at the product and supply chain level, with penalties for non-compliance. Technology makes it possible to move from reactive reporting to proactive reduction. At the same time, global regulations are tightening.
But I believe that more efficient packaging is the area with the greatest potential to improve sustainability metrics within the warehouse. The WSJ reports that Walmart has installed machines that churn out custom boxes at 12 of its fulfillment centers, and plans to add the technology to more facilities.
When it comes to executing mode-specific freight moves from origin to destination efficiently, reliably, and cost-effectively, transportation execution and visibility solutions play a critical role. But, if a company wants to work with a new supplier, and that supplier is in the network, metrics on that carrier also exist. Infor Nexus.
Reporting and Analytics Data is power. Your shipment management software should provide detailed reports and analytics to help you make informed decisions. Article and permission to publish here provided by Kevan Webb.
We organize all of the trending information in your field so you don't have to. Join 102,000+ users and stay up to date on the latest articles your peers are reading.
You know about us, now we want to get to know you!
Let's personalize your content
Let's get even more personalized
We recognize your account from another site in our network, please click 'Send Email' below to continue with verifying your account and setting a password.


Let's personalize your content