This site uses cookies to improve your experience. To help us insure we adhere to various privacy regulations, please select your country/region of residence. If you do not select a country, we will assume you are from the United States. Select your Cookie Settings or view our Privacy Policy and Terms of Use.
Cookie Settings
Cookies and similar technologies are used on this website for proper function of the website, for tracking performance analytics and for marketing purposes. We and some of our third-party providers may use cookie data for various purposes. Please review the cookie settings below and choose your preference.
Used for the proper function of the website
Used for monitoring website traffic and interactions
Cookie Settings
Cookies and similar technologies are used on this website for proper function of the website, for tracking performance analytics and for marketing purposes. We and some of our third-party providers may use cookie data for various purposes. Please review the cookie settings below and choose your preference.
Strictly Necessary: Used for the proper function of the website
Performance/Analytics: Used for monitoring website traffic and interactions
In my work tonight, I carefully studied 2006-2015 financial results to select the Supply Chains to Admire winners. Higher percentage of growth than the industry average for the period of 2006-2015. Greater margin performance than the industry average for the peer group for the period of 2006-2015. Operating Margin.
Here we share the answers to the questions that we get the most often about this research: What is the source of data? We placed them in the industry that they were the most like, e.g., the primary source of revenue. As a result, we report their results along with their pharmaceutical peer group.
There is an ongoing debate in supply chain management research about whether or not resource-based theory suggests that supply chain management can be a source of sustained competitive advantage for a firm. In his insightful article, The competitive advantage of interconnected firms: An extension of the resource-based view (AMR, Vol.
In 2003, Walmart announced that all of its suppliers would need to have Radio frequency identification (RFID) tags on all pallets and cases by 2006. According to Atlas RFID, Active RFID tags require a power source, and therefore can initiate communication with a reader (beacon).
While the performance rankings were based on comparisons of inventory turns, operating margin and Return on Invested Capital (ROIC) for the periods of 2006-2013 and 2009-2013, the concept is that to be a supply chain leader you must outperform and drive improvement. How do you balance the trade-offs between source, make and deliver?
Shown in Figure 2, we track the results for the period from 2006-to 2021. So, while companies can achieve economies of scale in administration, sales, and logistics, the economies of scale for make, source, and deliver only happen when companies aggressively manage complexity. Note the significant market volatility in the sector.).
Here we share the answers to the questions that we get the most often about this research: What is the source of data? We placed them in the industry that they were the most like, e.g., the primary source of revenue. Which companies were considered in the study? How did you select the final list of fifteen companies ?
The orbit chart in Figure 1, shows the relative rate of improvement at the intersection of inventory turns and operating margin for the period of 2006-2017. Orbit Chart for Rockwell Automation at the Intersection of Operating Margin and Inventory Turns for the Period of 2006-2017. Ernest Nicolas joined Rockwell Automation in 2006.
This is the same list I discussed in my research in 2006. I find LinkedIn to be a great source to get data. These issues form the backdrop of S&OP dysfunction, and they are the same issues in the research over the past two decades. We are not making progress. I will give advice on the other topics in later posts.
Diversity of sources (carriers + vendors + customers). In 2006, British mathematician Clive Humby coined the phrase “data is the new oil” to help make his point that corporate data has the potential to be an incredibly valuable resource. trillion terabytes of new data every day.). Data integrity.
Orbit Chart of Dow Chemical and BASF for the Period of 2006-2016 and Performance Data for the Chemical Industry. Performance Data for the Chemical Industry for 2006-2016. I find the discussion stimulating.
To help, in this post, we provide you with some insights for the period of 2006-2015. In our recent analysis of supply chains that are “working well” , we find higher performance when companies have source, make and deliver reporting to the supply chain organization. A Look at History. Organizational structure matters.
The orbit chart in Figure 1, shows the relative rate of improvement at the intersection of inventory turns and operating margin for the period of 2006-2017. Orbit Chart for Rockwell Automation at the Intersection of Operating Margin and Inventory Turns for the Period of 2006-2017. Ernest Nicolas joined Rockwell Automation in 2006.
Published in 1998, The relational view: Cooperative strategy and sources of interorganizational competitive advantage by Dyer and Singh remains one of the most influential business papers. The relational view has later been extended by Lavie (2006). Theory Article Dyad Network Relationship Supply Chain Management'
In 2006, they made a decision to implement a supply chain planning solution. Comprehensive view of source, make and deliver. Most often the focus is on transportation or logistics, but does not take into consideration the trade-offs between make, source and deliver. Focus is on make, source and deliver together.
In our work on the Supply Chains to Admire report , we tracked the progress of manufacturing, retailing and distribution companies for the period of 2006 to 2013 and 2009-2013. Performance of High Tech and Electronics Supply Chains for the Periods of 2006-2013 and 2009-2013. First Phase: 2002-2006. Second Phase: 2006-2014.
In Figure 1, I share a composite orbit chart of progress of Cisco Systems, Intel, Samsung and Flextronics on the Effective Frontier at the intersection of inventory turns and operating margin for 2006-2012. This is the clear articulation of when and how to make, source, and deliver for the community. What can we learn?
The field of supply chain management–combining source, make and deliver–into a common process started in 1982. Here I show orbit chart comparisons at the intersection of operating margin and inventory turns for the period of 2006-2017. Consistent data is not available prior to 2006.) The evolution sprung from chaos.
In 2004-2006, Greg Aimi (now a Gartner analyst) and I worked on a common definition of visibility for over a year. These sources while functional are difficult to connect. There are no solutions that connect source, make and deliver in many-to-many architectures. The use of disparate data sources enriches insights.
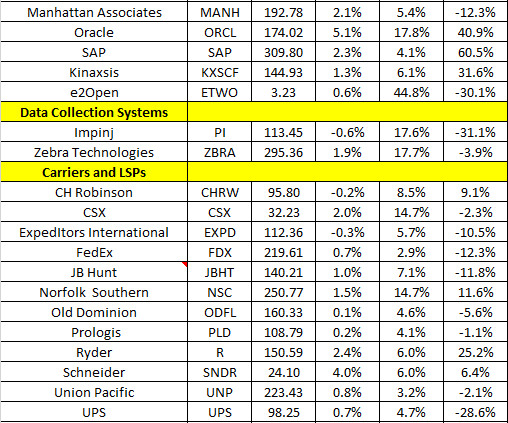
See performance for the past week, month and year for each stock and the whole index in the chart below: Source: SCDigest Feedback No Feedback on this article yet.
” They draw this conclusion from the World Bank’s Entrepreneurship Database which has been tracking formal global entrepreneurship since 2006. ” Source: Entrepreneurship Database Meunier and his colleagues also report that global economies experienced a rebound in new business registrations in 2021.
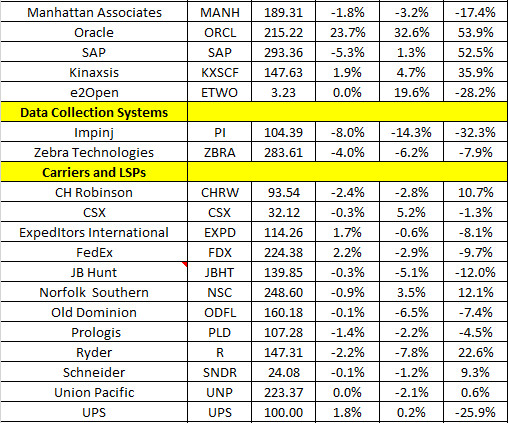
See performance for the past week, month and year for each stock and the whole index in the chart below: Source: SCDigest Feedback No Feedback on this article yet.
Quickly moving towards his true passion of operations, Jeff spent 2006-2016 in various roles with the nation’s largest building products Distributor, BlueLinx. In 2016, Jeff partnered with Franklin Young to purchase PTI Security, a leader in Physical Access Control and with support from Source Capital, an Atlanta based Private Equity firm.
Adapted from Ehrlich (2002); Stamatis (2002); George (2003); Bendell (2006); Bhuiyan et.al, (2006); Andersson et.al, (2006); Arnheiter and Maleyeff (2005); Nonthaleerak (2005); Kumar (2007); Magnusson et.al, (2003) Read more on Top 15 Lean Six Sigma Books to Level Up Your Continuous Improvement Efforts & Strategy on our website SCMDOJO! .
Established in 2006, KION operates a multi-brand business portfolio, including renowned brands like Linde Material Handling, STILL, Dematic and Baoli. The inefficiencies of manual data management hindered KION’s ability to create sourcing events quickly and maintain seamless supplier relationships.
Financial reengineering focuses on the optimization of short-term results that are usually based on a functional analysis of source, make, or deliver. Few consultants understand the interrelationships between source, make and deliver. Comparison of Emerson Electric and Schneider Electric for the Period of 2006-2016. Reflections.
Logistical Efficiency in Sourcing, Distribution, and Delivery Local Sourcing: While offering potential environmental benefits, local sourcing introduces complexities like smaller vehicle sizes and less-than-full loads. Balancing consumer preferences for locally sourced products with logistical efficiency is crucial.
Initially, I worked with Arizona State statistics professors and graduate students to correlate market factors to 2006-2012 data.) In addition, Project Zebra–an open source initiative to define outside-in planning processes–starts the testing phase of two of eighteen capabilities next week. I hope to see you there!
Founded in 2006, MSDUK is the UK’s leading supplier diversity advocacy organization working for inclusion of non-white ethnic minorities in corporate supply chains. We stock more than 700,000 industrial and electronic products, sourced from over 2,500 leading suppliers, and provide a wide range of product and service solutions to over 1.2
When we do these types of analysis, we look back at the data as far as we can reach (Y chart data is available only back to 2006 in a reliable form) and then we look at the period of 2006-2014 and the more recent period of 2011-2014. (This is an analysis of traditional retail minus eCommerce pure plays.) The difference?
Source: Google. Descartes Systems Group Revenue 2006-2018 (Source: macrotrends). Without going into all the details, it’s sufficient to say that Descartes (still a client today) came dangerously close to joining the others in the dotcom cemetery. Where is Descartes today?
The latest addition to this portfolio includes LTL and truckload freight services, which complements UPS’s global capabilities to provide customers a single source for multiple modes of transportation. The Overnite subsidiary was renamed as UPS Freight in 2006. UPS also has guaranteed day-definite delivery and expedited services.
This article explores challenges identified in a research paper by McKinnon (2006) focusing on vehicle utilization and efficiency in the freight industry [1]. Note: This citation replaces citation number 6, which did not have a specific source identified in the research paper) [7] Shaheen, S., & Schafer, A. Routledge. [8]
See the simple form from Hopper below: Source: Steve Hopper The seven ways included steps such as turning supervisors into true coaches, recognizing and rewarding performance, effective use of huddles, encouraging employee suggestions, doing frequent “gemba” walks and a few others. Interesting.
Orbit Chart of Supply Chain Performance at the Intersection of Operating Margin and Inventory Turns for the Period of 2006-2015. which focuses on digitization focusing on sourcing, manufacturing, sales & marketing and supply chain. Comparison of Performance and Improvement of Companies in the Chemical Industry for 2009-2015.
Chris Hahn from Coupa did a demo for me, showing me the ease with which Coupa software allows Accounts Payable and Sourcing groups to access all of their data online.
In 2006, lithium-ion batteries consumed only 20% of the global cobalt supply. However, as standards for sourcing become more strict, these big players may lose business if they fail to provide visibility into their supply chains. The famously idealistic Silicon Valley company has pledged to source all of its cobalt in North America.
If you have an efficient ERP system, information can flow freely between your source-to-pay applications and the companys central IT infrastructure. So, we have skin in this game! Now lets declare a disinterest. We are ERP-agnostic.
We first implemented Blue Yonders transportation management [solutions] in 2006. Sources: 1 Gartner, Magic Quadrant for Transportation Management Systems, Brock Johns, Oscar Sanchez Duran, Carly West, Manav Jain, 25 March 2025. 2 Blue Yonder was previously listed as JDA; the company rebranded to Blue Yonder in February 2020.
To reduce inefficiencies and fraud, grant activities are governed by several regulations including these two relatively recently enacted laws: The Digital Accountability and Transparency Act of 2014 (DATA Act) – This law expands on federal awards reporting reforms that began with the Federal Funding Accountability and Transparency Act of 2006.
I followed his journey during the period of 2006-2011, and wanted to check in with him to gain his insights on the selection of VTech as a finalist in the Supply Chains to Admire research. Orbit Chart of VTech for the Period of 2006-2015 at the Intersection of Operating Margin and Inventory Turns .
The speakers and the attendees all likened this moment in AI adoption to other key moments in time – it’s 1997 and the internet is gaining traction, its 2006 and the smartphone is revealing its power, and, now, it’s 2023 and the curtain is going up on Act 1 of the generative AI play. Basically, the data feeding the open AI systems (e.g.,
Supply Market Intelligence (SMI) is the mechanism by which organizations make as complete analysis as possible of a current or targeted supply base, including adoption of supplier-specific and market risks (Handfield, 2006). These interviews are often the best source of information and are not published. Handfield, R.B.
We organize all of the trending information in your field so you don't have to. Join 102,000+ users and stay up to date on the latest articles your peers are reading.
You know about us, now we want to get to know you!
Let's personalize your content
Let's get even more personalized
We recognize your account from another site in our network, please click 'Send Email' below to continue with verifying your account and setting a password.


Let's personalize your content