article thumbnail

Supply Chain Leaders Rearranging Deck Chairs? Yes, I Think So.

Supply Chain Shaman

The supply chain is complex non-linear system that is easily thrown out of balance through a focus on functional metrics. They rock back and forth in improving singular metrics but struggle to improve a portfolio of growth, margin, inventory performance, and asset utilization. Comparing 2010-2019. Change metrics systems.

article thumbnail

Good-bye. I Will Go Forward by Going Forward.

Supply Chain Shaman

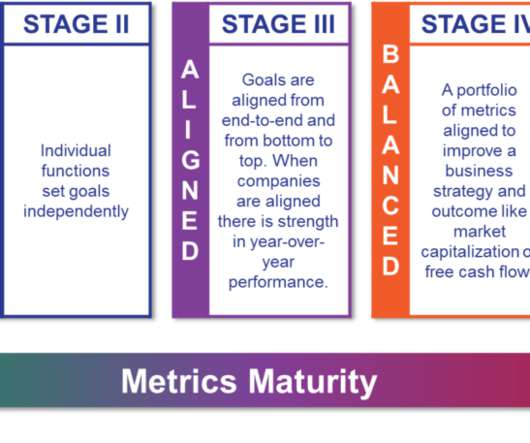
I will miss our spirited debates and sparring matches on market trends. I worked with Roddy when I was at AMR Research from 2006 to 2010. As a strong proponent of maturity models, many discussions centered on the movement from program-based to functional metrics and how to drive alignment. Metrics That Matter Model Evolution.

Modeling 195
Insiders

Sign Up for our Newsletter

This site is protected by reCAPTCHA and the Google Privacy Policy and Terms of Service apply.

article thumbnail

Looking Beyond Red Arrows

Supply Chain Shaman

It is hard work to maintain the status quo in metrics performance. A balanced portfolio of metrics delivers the greatest value. We are making a mistake of having companies tasked with a force march to implement the “tightly integrated supply chain” that is inflexible and cannot sense market trends. Many fail.

article thumbnail

Supply Chains to Admire Household Nondurables Calculation Example

Supply Chain Insights

Balance looks at the change in Revenue Growth and the change in Return on Invested Capital (ROIC) over the years included in the analysis (2010 – 2016). For this reason, a company shows greater balance if the improvement of one of the metrics does not cause a negative effect on the other. P&G Balance Metrics. Resiliency.

Examples 137
article thumbnail

Mining Supply Chain Data for Insights

Supply Chain Shaman

We loaded 493 financial metrics from balance sheets and income statements for each company into the data lake for the period of 2004-2016 using YCharts data. In addition, we enriched the data lake with 20 market indexes on cost, growth and market trends. Correlations Between Survey Factors and Financial Metrics. Shifting Trends.

article thumbnail

Tell Me Why

Supply Chain Shaman

As a result, tor most companies, the goals are unclear and the financial metrics are not well-understood. When I started this research in 2010, I believed that P&G and Wal-Mart would meet this criteria. This year-over-year comparison, enables visualization of performance on two metrics. ” The answer will be “Yes!

article thumbnail

Supply Chain Diagnostic: A Four-Step Process

Supply Chain Shaman

Build an industry peer group and gain insights on major trends. In Figure 1, we show the aggregate trend of the chemical industry in an orbit chart format showing year-over-year results at the intersection of two metrics operating margin and inventory turns. Ecolab was able to overcome the downward trend.