This site uses cookies to improve your experience. To help us insure we adhere to various privacy regulations, please select your country/region of residence. If you do not select a country, we will assume you are from the United States. Select your Cookie Settings or view our Privacy Policy and Terms of Use.
Cookie Settings
Cookies and similar technologies are used on this website for proper function of the website, for tracking performance analytics and for marketing purposes. We and some of our third-party providers may use cookie data for various purposes. Please review the cookie settings below and choose your preference.
Used for the proper function of the website
Used for monitoring website traffic and interactions
Cookie Settings
Cookies and similar technologies are used on this website for proper function of the website, for tracking performance analytics and for marketing purposes. We and some of our third-party providers may use cookie data for various purposes. Please review the cookie settings below and choose your preference.
Strictly Necessary: Used for the proper function of the website
Performance/Analytics: Used for monitoring website traffic and interactions
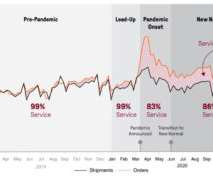
Functional Metrics and the Lack of Alignment to Strategy. Few companies are clear on the number of supply chains they operate, design the rhythms and cycles of each, and align metrics to the strategy. Figure A: Beverage Industry Aggregate Industry Trend 2014-2023 Figure B. The industry is not clear on desired outcomes.
billion rate data points monthly to provide the most comprehensive view of the market, helping you identify savings opportunities and make data-driven decisions.
The group’s response is, “Are these supply chain metrics?” ” For many stuck in the myriad of functional metrics, like Operational Efficiency (OEE), Purchase Price Variance (PPV), or transportation cost, a focus on growth, operating margin, inventory turns, and Return on Invested Capital (ROIC) is a stretch.
As a result, the metrics have to be viewed together as a pattern over time. In the journey, the supply chain leader needs to improve the potential of a portfolio of metrics. The metrics of growth, Return on Invested Capital, Inventory Turns and Operating Margin have the highest correlation to market capitalization.
The use of orbit charts allowed me to see the patterns of performance at the intersection of metrics over time. Performance of PepsiCo Compared to Beverage Peer Group for the Period of 2013-2023 Now let’s compare these patterns to a company driving improvement and outperforming. Let’s take a look at PepsiCo.
The AMR Top 25 was the first methodology that tried to connect financial metrics with supply chain excellence. It elevated the discussion on supply chain excellence and drove more discipline and rigor in the use of financial metrics. See how different the progress is on this metric by industry? The intent was good.
Smaller, more agile companies outperform the larger and well-known brands in the retail, beverages, food, and pharmaceutical industry sectors. We selected these metrics based on correlation work with Arizona State University in 2012. The companies I work with struggle to set metrics targets. Celebrating Success. Target Setting.
by Jeswin Philip The Food Packaging Trends and Advances report from PMMI forecasts that the US Food and Beverage industry will experience a 2.9 % CAGR through 2022. As with any industry, food and beverage faces its own unique set of supply chain challenges, including: Expiring ingredients, manufactured product and packaged goods.
The second story is about a regional beverage manufacturer. It is my hope that we can side-step political discussions demonstrated in my stories and ground the problem solving in scientific methods to understand the properties of data, the potential of supply chains through modeling, and the alignment of metrics.
billion rate data points monthly to provide the most comprehensive view of the market, helping you identify savings opportunities and make data-driven decisions.
They provide these solutions to some of the largest consumer goods and food & beverage companies in the world. They can then use the data to provide an apples-to-apples benchmark on a variety of innovative supply chain metrics applicable to the grocery supply chain. Forecasting Accuracy Was Terrible . That is an all-time low.
OTIF is a key supply chain metric. He works alongside clients ranging from some of the largest food and beverage businesses in the world to the brightest up-and-coming CPG brands in North America. Andrew Lynch and Joe Lynch discuss the true cost of OTIF failure. About Andrew Lynch.
So, for other ERP providers, a food & beverage template supports all food and beverage companies. In contrast, the Infor food & beverage solution supports micro verticals. That functionality is necessary for bakeries, dairies, and beverage manufacturers, but perhaps less important for other F&B subverticals.
The script will be distributed to CFOs of apparel, consumer packaged goods, and food/beverage companies next week. Aligned Metrics. Following the conference, Alexia asked for me to share the methodology with over 150 financial analysts. So, I wanted to give you a heads-up on their questions, and my answers. Supply Chain Design.
Food and beverage manufacturing and distribution companies usually operate on smaller margins than most organizations in other industries. Unfortunately, a significant chunk of food and beverage companies’ raw materials are commodities, whose prices don’t just fluctuate from month to month but can change hour-by-hour.
The food and beverage industry is an ever-fluctuating landscape with a constant demand for operational efficiency. This is especially critical in industries like food and beverage, marked by short product shelf lives and significantly varying demand. Second, the addition of financial metrics into the process which now gives us IBP.
The latter refers to a single variable standard (SVS), by which one metric, such as cases per hour, is expected to tell all. What’s more, because an SVS approach only accounts for one metric at a time, a host of other equally if not more important metrics are bypassed, leaving you largely in the dark. Ad infinitum.
The next posts in the series will break down metrics and issues to consider in SQM by industry and conclude with a case study on the application of SQM. 5 Key Metrics to Use for Scoring Supplier Quality Management (From LNS Research ). The definition of this metric is similar to the way it sounds. Cost of quality.
Cash-to-Cash Metrics. Cash-to-cash is a compound metric: (Days of Receivables+Days of Inventory)-Days of Payables=Cash Conversion Cycle. Do you find it ironic that the companies with the highest margins like pharmaceuticals, beverage and beauty increased payables the most? In times of uncertainty, cash is king.
PepsiCo is a very big company, the second largest food and beverage company in the world. PepsiCo generated $79 billion in net revenue in 2021, with 23 food and beverage brands that generate more than $1 billion each in retail sales. 294 manufacturing facilities produced more than 90 million metric tons of food and beverage in 2021.
The food and beverage company was selected for award negotiations to receive up to $170 million from the Department of Energy’s Office of Clean Energy Demonstration to support the implementation of clean energy projects at 10 of the company’s US plants.
The global alcoholic beverages market is forecast to grow to $3,875 billion by 2032. The global non-alcoholic beverage market size is projected to grow to $3.8 At the same time, beverage producers, like food producers and others, are being pressured in multiple directions. trillion by 2034.
The supply chain is a complex system with finite, and non-linear relationships between supply chain metrics that drive balance sheet results. We find that companies can improve one, but not two of the metrics. Teams struggle to drive improvement in both metrics at the same time. A Look at History. Resiliency.
From retail and food and beverage to manufacturing and life sciences, companies from a wide variety of industries are realizing the benefits of the technology, revolutionizing how they operate, collaborate, and generate value. The food and beverage sector also benefits from the cloud.
Supply chain leaders manage a complex system of non-linear, but very inter-connected metrics. Leaders need to balance a portfolio of metrics. Year-over-year Improvement at the Intersections of the Metrics. It is for this reason, that we are hard at work on the analysis of the Supply Chain Metrics That Matter series of reports.
Unfortunately, we find most companies are moving backwards on the Supply Chain Metrics That Matter™ or making progress on singular metrics versus driving performance improvement on a balanced portfolio of supply chain metrics that correlate to market capitalization. (If The winners and finalists are an elite group.
Today’s business goals include financial as well as operational metrics, the trade-off between cost and service is only one of a number of competing priorities. New KPI’s are also being prioritized, including sustainability metrics. Business based outcomes. Optimization and analytics.
OTIF is a key supply chain metric. He works alongside clients ranging from some of the largest food and beverage businesses in the world to the brightest up-and-coming CPG brands in North America. Andrew Lynch and Joe Lynch discuss the true cost of OTIF failure. About Andrew Lynch.
Unlike most of the KPIs we recommend, perfect order is a composite of several elementary metrics. Damage-free delivery: This measurement is sometimes incorporated into the in full KPI, but can just also be a stand-alone metric. What about DIFOT?
Figure 1: Supply Chain Metrics Are a Balancing Act. The metrics shown in Figure 1 are difficult to improve together. Most companies improve singular metrics but are not able to drive portfolio. An orbit chart is the linking of data across years at the intersection of two metrics. improvements. I was wrong. Wrapping Up.
Industries included manufacturers, retailers, automotive, food & beverage, CPG and healthcare shippers. Coyote is committed to providing a better service experience in the transportation industry, raising the standards for service metrics and customer satisfaction. Businesses ranged in size from $250M to over $5B in annual revenue.
Here “near real-time” is defined as a refresh of key metrics every five minutes. The customers at the conference included very large food & beverage companies, the largest 3PL in the world, and companies from other industries as well. Overcoming the Objections of IT. But getting this data has not been easy.
Overall Results on the Supply Chain Metrics That Matter. In the last five years, consumer products and food/beverage leaders faced different challenges. Overall, in the industry, there is more forward momentum in consumer products sector than the food/beverage peer groups. How Have They Done? They cannot be grouped together.
Compliance and quality are the foundations all great food & beverage manufacturers rely on to create and strengthen trust with their distribution networks and customers. Traceability Is Key To Excelling At Compliance And Quality for Food & Beverage Manufacturing Companies.
On today’s episode we welcome Andrew Lynch, Co-Founder & President of Zipline Logistics, an award-winning logistics service provider that specializes exclusively in the transportation of retail consumer goods and food and beverage products. Capacity & Carrier Metrics Resources to Download. Download E-Book.
Unfortunately, we find most companies are moving backwards on the Supply Chain Metrics That Matter™ or making progress on singular metrics versus driving performance improvement on a balanced portfolio of supply chain metrics that correlate to market capitalization. (If The winners and finalists are an elite group.
I was on a call last week with a large company in the food and beverage space that has spent $100s of millions, and many years, on an ERP deployment. The issue is that none of their IT investments in the last 10 years have moved the needle on operational metrics such as inventory levels, case fill rates, and other operational metrics.
In its 2021 survey, Deloitte once again affirmed the fact that more digitally mature businesses outperform industry averages on a variety of financial metrics. The authors refer to the bounty of benefits that accrue from digital maturity. And we couldn’t agree more. Digitally Mature Manufacturing: Bickford’s.
We then rated companies on their ability to manage and improve a portfolio of metrics: operating margin, inventory turns and Return on Invested Capital (ROIC). Delivery Metrics: Perfect order delivery although good to continually refine. It is a story of when the going gets tough, the tough get going. 2015 Supply Chains to Admire.
The selection of metrics is based on prior work with Arizona State University to understand which metrics, in combination, correlate to market capitalization and price to book value. Why do we spend four months doing this? We aim to move companies from a cost-based agenda to drive value in their supply chains. Congrats to all.
billion rate data points monthly to provide the most comprehensive view of the market, helping you identify savings opportunities and make data-driven decisions.
We have found that supply chain metrics are gnarly and complicated.During Food and Beverage Company Performance on the Supply Chain Index for the Period of 2006-2012. In our program, cost avoidance, while desirable, does not count towards the metric. We named it the Supply Chain Index. Our aim was to maintain a 3 to 3.5
In the food & beverage industry, farmers are the key suppliers. According to the company, its program paid $4 million to farmers for 200,000 metric tons of carbon in 2021. The post Reducing Emissions in the Food & Beverage Industry Requires Farmers to Make Progress appeared first on Logistics Viewpoints.
How To Leverage The Benefits Of S&OP For The Food And Beverage Industry? Supply chain-focused organizations like the food and beverages industry can turn the tide with an efficient S&OP process and improve their overall business performance. How different is S&OP in the volatile world of the food and beverage industry?
We organize all of the trending information in your field so you don't have to. Join 102,000+ users and stay up to date on the latest articles your peers are reading.
You know about us, now we want to get to know you!
Let's personalize your content
Let's get even more personalized
We recognize your account from another site in our network, please click 'Send Email' below to continue with verifying your account and setting a password.


Let's personalize your content