This site uses cookies to improve your experience. To help us insure we adhere to various privacy regulations, please select your country/region of residence. If you do not select a country, we will assume you are from the United States. Select your Cookie Settings or view our Privacy Policy and Terms of Use.
Cookie Settings
Cookies and similar technologies are used on this website for proper function of the website, for tracking performance analytics and for marketing purposes. We and some of our third-party providers may use cookie data for various purposes. Please review the cookie settings below and choose your preference.
Used for the proper function of the website
Used for monitoring website traffic and interactions
Cookie Settings
Cookies and similar technologies are used on this website for proper function of the website, for tracking performance analytics and for marketing purposes. We and some of our third-party providers may use cookie data for various purposes. Please review the cookie settings below and choose your preference.
Strictly Necessary: Used for the proper function of the website
Performance/Analytics: Used for monitoring website traffic and interactions
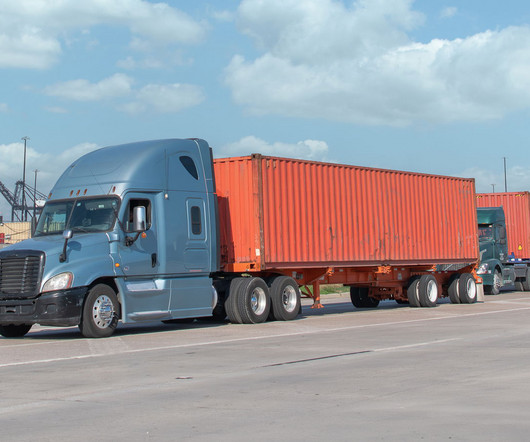
However, as carbon taxes and emissions reporting requirements continue increasing, supply chain professionals face mounting pressures from inside and outside their organizations to measure and improve performance against new, nebulous sustainability metrics. Freight transportation makes up over 10% of total global carbon emissions.
Solvoyo has a metric they call the user acceptance rate. This metric measures the percentage of time the planners accept replenishment, transportation, or inventory plans as they are without any change in the timing of the delivery or the quantity to be delivered. You manufacture stuff. Forecasting is not an actionable item.”
Transportation metrics saw little change in May as capacity, utilization and pricing remained in expansion territory, according to a monthly survey of supply chain professionals. reading for transportation capacity during May, which was roughly in line with April. continued to step meaningfully higher. in the second half.
Scaling manufacturing operations is crucial for business growth but presents unique challenges. Balancing increased demand with consistent quality and controlled costs is difficult but essential for manufacturers looking to expand. Successfully scaling manufacturing requires more than just adding resources.
Workforce shortages and other challenges abound throughout all transportation sectors, and while this may revitalize investments in localized manufacturing, expanded warehousing to hold more inventory, and other efforts, these changes do not solve today’s issues. Carrier capacity tops the list of parcel shippers’ challenges.
Flex AI to Support Manufacturing Flow Flex uses artificial intelligence to improve production quality and efficiency in electronics manufacturing. Built-In Sustainability Reporting Some orchestration tools are adding carbon tracking or energy use metrics alongside cost and delivery performance data.
billion rate data points monthly to provide the most comprehensive view of the market, helping you identify savings opportunities and make data-driven decisions. million+ transactions annually This network effect means better visibility, more competitive rates, and unparalleled connectivity across the global logistics landscape.
When a critical Tier-2 supplier is affected by a tariff policy change or regional shutdown, the ripple effects often catch manufacturers by surprise. Metrics must reflect the new priorities. Second, many supply chains still lack visibility beyond Tier-1 suppliers. Finally, rigid fulfillment networks compound the problem.
That’s the power of manufacturing data collection. Manufacturing data collection is your secret weapon for boosting efficiency, cutting waste, and staying ahead of the competition. Manufacturing data collection is your secret weapon for boosting efficiency, cutting waste, and staying ahead of the competition.
The first story is about a large regional food manufacturer. The second story is about a regional beverage manufacturer. As error increases, there is a need for additional capacity. It takes more capacity as demand error increases.). This was the case for the client stories that I will share in this blog. The answer?
Advanced planning evolved with a focus on modeling manufacturing constraints. With the contraction of air capacity and the unprecedented level of imports to the United States from Asia, logistics constraints grew in importance in the pandemic. Watermelon Metrics Don’t Drive The Right Results. What are functional metrics?
Space Utilization: Increase available storage capacity, better organize high-demand items, and optimize vertical space. Effective space utilization translates directly to increased storage capacity and reduced warehouse footprint and operational costs. Which warehouse performance metrics should be tracked?
imports, according to Maersk’s container-weighted effective average tariff rate metric,” the company said. “At West Coast ports have fallen sharply in recent weeks on weaker demand following an initial surge as liner operators rushed to restore vessel capacity during the tariff pause. China and the U.S. in June, 2021.
billion rate data points monthly to provide the most comprehensive view of the market, helping you identify savings opportunities and make data-driven decisions. million+ transactions annually This network effect means better visibility, more competitive rates, and unparalleled connectivity across the global logistics landscape.
Frank, the line manager for manufacturing, dominated the meetings. We had a choice to either install newer high-capacity machines for the Jell-O lines (CM Bartelts) running at over 1500 packages/minute or slower, more flexible equipment (IM Bartelts) at a rate of 650 pouches/minute. The second step is to align metrics to the strategy.
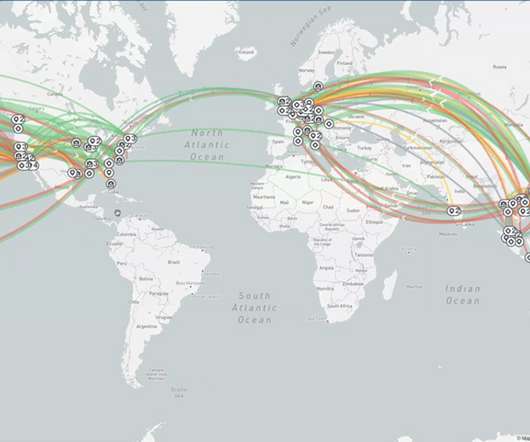
In a survey of 150 global manufacturing executives, 47% committed to improving supply chain visibility and tracking. Supply chain visibility often means “where’s my stuff,” or the ability to trace parts in transit from the manufacturer to the final destination. What is supply chain visibility? Agility to act on transparency.
As with the logistics category where we featured 15 most popular blog posts vs. the 10 we covered in the top manufacturing blog posts and supply chain blog posts , we write so many transportation blog posts in that category, we are going to feature the 16 most viewed transportation blog posts. Read the Full Blog Post.
What are Total Manufacturing Costs? Your total manufacturing costs are essentially an expense analysis that calculates how each of your company’s departments contributed to producing a finalized product. This looks at all stages of the manufacturing process from raw materials to work-in-progress to final result.
Throughout the supply chain, the use of metrics to track and understand processes provides an invaluable resource for ensuring increased production and customer satisfaction. What Distribution Center Metrics Need Tracking? However, the most important metrics can be categorized into the following eight areas. On-Time Shipping.
The widespread supply chain disruptions that happened when the global pandemic hit in 2020 highlighted several important lessons regarding manufacturing and supply chain visibility. Powered by the 3DEXPERIENCE platform, DELMIA takes a model-based, data-driven approach by connecting the virtual and real worlds of manufacturing and operations.
Much of our world relies on the timeliness, effectiveness, quality, and reliability of manufacturers. In this regard, the sector that keeps our societies, infrastructure, businesses, and consumption ticking along is in search of capacity clarity in order to keep their promises. Are production facilities running at peak capacity?
Supplier Collaboration: Fundamental to Elevating Manufacturing Performance Supplier relationships are at the heart of manufacturing performance. That’s why supplier collaboration—that consistent, trusted, and responsive interaction between supplier and manufacturer—is pivotal to manufacturing success.
There can be surprises that potentially offer a better upside: demand is higher than expected, it is possible to raise prices without affecting demand based on what is happening with competitor products, technology has allowed manufacturingcapacity to ramp up faster than expected, etc. billion transactions annually.
Supply Planning Supply planning systems create models that allow a company to understand capacity and other constraints it has in producing goods or fulfilling orders. Fulfillment constraints can include how long it will take to deliver goods to a destination, warehouse capacity, and warehouse labor requirements. Medium-term planning.
Both companies provide packaging materials to the food manufacturing industry. Their goal was to visualize excess capacity and make it available to enable their sales teams to offer upstream opportunities to their clients. Food manufacturers, over the course of the last decade, have pushed costs and waste backwards in the supply chain.
UPS is seeking alternative strategies for its truck brokerage business, which has seen sales plummet amid a freight recession marked by declining rates and over capacity. A factory in Suzhou was the company’s main manufacturing site for its semiconductor test equipment, which it subcontracted to Flextronics.
According to the UN Environment Program’s Food Waste Index, 923 million metric tons of food is wasted globally every year. The capacity to recycle or reprocess food waste worldwide is still limited and insignificant compared to the amount of food waste being generated. The Right Approach to Food Waste Reduction.
Manufacturers of these weight loss drugs face a multi-headed hydra of the three c’s: coverage, competition and capacity. But I’ll focus on capacity, since that is the supply chain lever. Historically these roles are siloed, focused on their own functional metrics.
During the 1980s, I was on a management team for a large manufacturer. The Company was attempting to gain economies of scale by grouping manufacturing technologies within a common infrastructure to reap the benefits of a co-generation facility, a centralized warehouse, and a talented administrative team. Lack of aligned metrics.
Keeping track of all your moving parts in manufacturing is a tall order. That’s where manufacturing inventory management software comes in. In this ultimate guide, we’ll break down everything you need to know about manufacturing inventory management software. Spreadsheets just don’t cut it anymore.
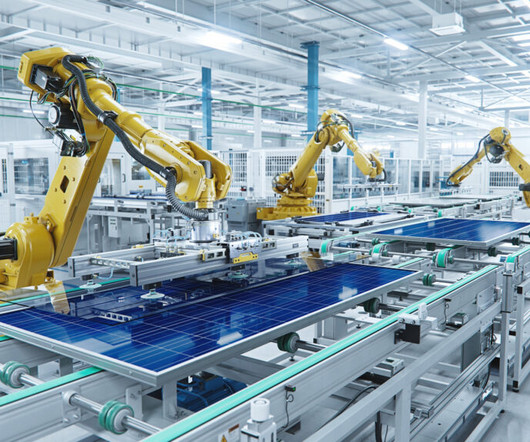
Automation is at the center of modern manufacturing businesses, with companies exploring the possibilities of artificial intelligence in improving workflows and profitability. Industrial engineers incorporate these technologies in designing and fabricating advanced manufacturing systems. How AI Is Changing the Manufacturing Industry.
It bought its main rivals to become North America’s largest fine paper manufacturer. [1] They also cut inventory levels, grew sales and resolved capacity issues. To overcome historical obstacles, Angleson set three ambitious goals: Change the relationship between the manufacturer and distributor from manipulation to collaboration.
Where and how manufacturers make products for Americans will change in 2017. Manufacturers must adapt to changing demands, or they will become nothing more than a statistic in history books. The "First Five" Industrial Manufacturing Trends of 2017. The "First Five" Industrial Manufacturing Trends of 2017.
This blog explains The Key MRP Metrics in Supply Chain whcih every supply chain professional in Manufacturing or Distribution Businesses. This is a fundamental principle of supply chain management, it constitutes a juggling act that is at the heart of any well-orchestrated manufacturing process.
A pound of apples costs about the same as a pound of steel, yet steel is a complex product produced using high-tech metallurgical and manufacturing processes. IBP is a multifunctional planning process that includes sales, marketing, demand planners, manufacturing, and finance. A ton of steel can cost as little as $700.
While Contract Pharma & BioPharma manufacturers continue to experience an increase in demand for more projects, new challenges are emerging from nearly every angle including new regulatory and quality requirements, workforce shortages and of course, supply chain disruptions. is likely to reach 2.1
Commerce is global and regional at the same time, the world is getting smaller and more interconnected, and Consumer Packaged Goods (CPG) manufacturers operate in this build-anywhere and sell-anywhere market. Here we have compiled a list of the top six challenges that CPG companies face in the post-pandemic market.
No company in either the household non-durable (consumer goods) or the food manufacturing group beat their peer group on the balanced scorecard of growth, inventory turns, operating margin, and Return on Invested Capital (ROIC) for 2013-2022. The supply chain has two important buffers–inventory and capacity. Any takers here?
Manufacturers and distributors experienced huge supply chain disruptions due to the pandemic which exposed many vulnerabilities and tested the resilience of supply chain leaders globally. Manufacturing KPIs. can be measured to define this metric. can be measured to define this metric.
The traditional metrics of excellence cost efficiency, on-time delivery while still important, are no longer sufficient in an era defined by volatility, complexity and political changes. Supply chain and logistics teams today face a pivotal moment in their evolution. Third, decision-making is evolving from human-led to AI-augmented.
Over the years, working for and with numerous manufacturing companies, I’ve seen many supply chain practices that cost companies money. So a scheduler at one plant has no visibility as to the inventory position, capacity or material supplies at another plant. by John Westerveld. Not having end-to-end supply chain visibility.
A planner could ask the SCP engine to achieve 95% service, with CO2 emissions under of under a million metric tons at a given factory in the coming month. The IBP plans are sent to the plants with what needs to be manufactured and to distribution on what needs to be shipped to customers. This would be a three-way tradeoff. No plan is.
The number one question that I am asked today by manufacturers across all industries is “How can I improve customer service?” The organization, tightly capacity-constrained failed to forecast and build capacity ahead of market demand. The two primary buffers in the supply chain are manufacturingcapacity and inventory.
Management practices such as lean manufacturing and just-in-time inventory management, along with globalization, have made tremendous impact on cost and service, but have accentuated risk. Metrics such as lead-times, forecast accuracy, inventory levels, and service are used to measure operational risks. are most exposed to risk?
We organize all of the trending information in your field so you don't have to. Join 102,000+ users and stay up to date on the latest articles your peers are reading.
You know about us, now we want to get to know you!
Let's personalize your content
Let's get even more personalized
We recognize your account from another site in our network, please click 'Send Email' below to continue with verifying your account and setting a password.


Let's personalize your content