This site uses cookies to improve your experience. To help us insure we adhere to various privacy regulations, please select your country/region of residence. If you do not select a country, we will assume you are from the United States. Select your Cookie Settings or view our Privacy Policy and Terms of Use.
Cookie Settings
Cookies and similar technologies are used on this website for proper function of the website, for tracking performance analytics and for marketing purposes. We and some of our third-party providers may use cookie data for various purposes. Please review the cookie settings below and choose your preference.
Used for the proper function of the website
Used for monitoring website traffic and interactions
Cookie Settings
Cookies and similar technologies are used on this website for proper function of the website, for tracking performance analytics and for marketing purposes. We and some of our third-party providers may use cookie data for various purposes. Please review the cookie settings below and choose your preference.
Strictly Necessary: Used for the proper function of the website
Performance/Analytics: Used for monitoring website traffic and interactions
The KPI Harnessing the collective experience of shippers in a more formal way is the KPI, a benchmarking survey for evaluating the performance of logistics service providers. Sample questions from the KPI survey Rankings and Results Results from previous surveys throw up interesting nuggets of information on shippers preferences.
In a survey we conducted in October 2020, 91% of our Indago supply chain research community members, who are all supply chain executives from manufacturing, retail, and distribution companies, either Agreed or Strongly Agreed that the time had come to transform the traditional transportation procurement process.
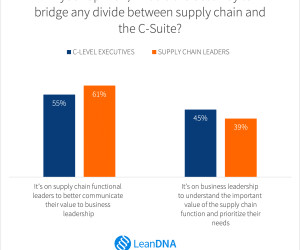
The survey indicates “that 84% of supply chain leaders say they are more focused on internal operations than customer needs, with 76% indicating they prioritize making new and innovative products over creating the best customer experience. For this research, 347 US supply chain leaders from different industries were surveyed.
In a July 2024 survey of our Indago supply chain research community and Alpega customers, almost three quarters of the respondents (72%) said that integrating a large “open network” of vetted and trusted carriers with a transportation management system (TMS) would be either “Extremely Beneficial” or “Very Beneficial.”
A new survey shows 55% of enterprises anticipate a major supply chain disruption to strike any time. No wonder, resilience is a top priority today. With disruptions looming, procurement and supply chain managers are stepping up their game. And guess what? Sixty-three percent believe AI can be their top ally in this mission.
A recent Descartes survey examining the most significant global trade issues facing logistics and supply chain leaders revealed that rising tariffs and trade barriers are their top challenge (48% of respondents)a shared concern among global companies of all sizes but more pressing for fast-growing organizations.
A First of its Kind Invest Engagement Survey Published Its Findings on Ensuring Seafood Companies Supply Chain Traceability The FAIRR Initiative, supported by investors with $75 trillion in assets, is working with seven major seafood companies to improve supply chain traceability, addressing risks like human rights violations and overfishing.
Key Takeaways: The Strategic COO: Navigating Disruption and Driving Change Kearney’s third annual COO survey, in collaboration with AWS, reveals that while COOs anticipate organizational growth in 2025, they foresee significant hurdles related to skills gaps and execution challenges.
A recent and timely survey published today points to continued perception or communication gaps and among business C-Suite and supply chain senior executives. Survey Structure This survey, sponsored by supply chain operations technology provider LeanDNA and conducted by Wakefield Research , involved a reported 100 U.S.
47% of marketers said they have a database management strategy in place, but there is room for significant improvement. Marketing and sales teams are feeling pressured to deliver authentic messaging to buyers at every point of their customer journey.
Conducted across key trading regions, the survey gathered insights from 978 leaders, emphasizing the importance of robust global trade intelligence for competitive and compliant operations.
This blog is based on Dassault Systèmes’ partnership with IndustryWeek on conducting a midyear survey of industry leaders to gain a better understanding of how virtualization technologies are helping them adapt to these changes. Today, change is the only constant, and success depends on the ability to adapt quickly and efficiently.
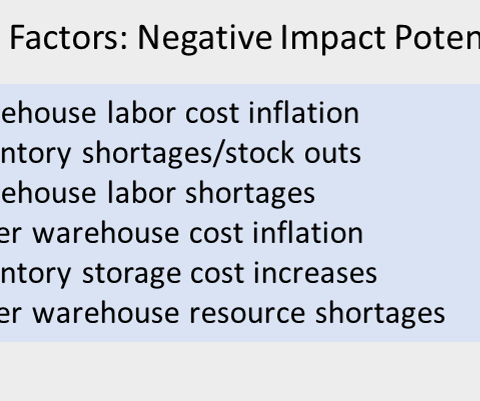
The Conference Board ( conference-board.org ), a well-known, global business membership organization, conducted its C-SUITE OUTLOOK survey in the fall of 2021. Its survey results showed supply chain disruptions, labor shortages, and rising inflation to be 3 of the 5 high impact external factors on the minds of CEOs.
Results from The Conference Board’s C-SUITE OUTLOOK survey showed supply chain disruptions, labor shortages, and rising inflation to be 3 of the 5 high impact external factors on the minds of CEOs. Here are some preliminary survey results thus far. There are numerous indications that supply chain is more critical than ever.
Sifted ran a survey to determine consumer attitudes towards eco-friendly shipping and packaging. We gained valuable insight into how it affects buying decisions, if they'll pay more for eco-friendly shipping, and much more.
In July, Freightos conducted a survey of over 100 small business importers and exporters, primarily from the United States, who utilize the Freightos.com marketplace for international freight. The survey aimed to explore the impact of these changes on their operations.
Technology tools that are easy to use were cited as critical features among 93% of survey respondents. Technology tools, notably desktop and mobile-enabled capabilities, were listed as in-demand benefits of 3PL partnerships among 86% of survey respondents. Download the Report: 2021 Peak Shipping Season Survey.
This increase in spending is not due to candy prices rising, the results from the survey show an overall candy prices only increased 0.9% This is nearly double the amount from a decade ago and it seems to be in line with the trend of Halloween gaining popularity in the last few years with the help of social media.
Ability to Meet Fulfillment Goals According to the survey, only a mere 1% of respondents achieve 80% or higher for their OTIF metrics, with the average percentage of OTIF being a mediocre 62.21%. While outsourcing to a 3PL is a common strategy, new technologies and approaches now exist to achieve higher OTIF rates in house.
Download this report, from a GEP-sponsored survey from ISM, to check your performance and see how your peers are reaching their transformation goals. Is your digital transformation working, or is it still a work in progress?
FreightWaves partnered with Echo Global Logistics to collect and analyze key projections for anticipated pricing trends, volume expectations, major challenges, and shifting demand patterns for 2025 based on comprehensive survey data from carriers and shippers. Interestingly, carriers are more invested in adopting digital tools than shippers.
using all of the test materials, survey results, blogs, YouTube content, and eBooks developed by Supply Chain Insights over the past five years. To drive engagement, the course is supported by a Large-Language Learning Model with multi-language support designed by WAEL ~ from utheral.ai The class kick-off is in ten days.
Let me explain, if you fill out one of my surveys on LinkedIn, I share the research results in front of the paywall (I believe that supply chain research should be readily available and not locked behind a paywall.) (If I appreciate you as a reader and enjoy your comments. Over 28,000 readers read this blog. I give thanks.
It introduced the survey we had just launched to determine the perceptions, priorities, and strategic initiatives of today’s supply chain and logistics executives. This post was subsequently followed by two articles that discussed some of the findings from the survey. One executive simply stated that it’s “an easy variable to address.”
Hanover Research recently conducted a survey that investigates the role of analytics from the perspective of knowledge workers, people who handle or use information as part of their jobs.
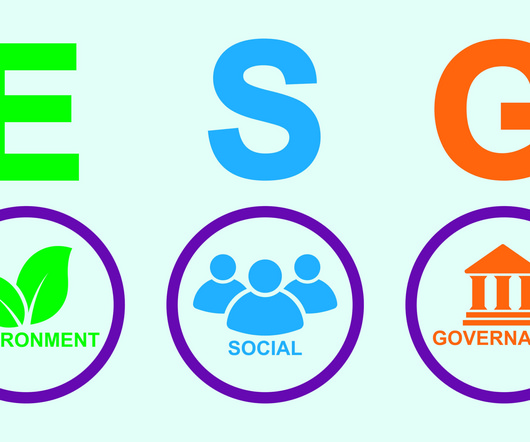
Today’s article is the fifth part in a series featuring surveys from APQC on supply chain topics including ESG in supply chain , environmental sustainability , last mile , digital transformation. Survey respondents are second most likely to have implemented Robotic Process Automation in sourcing and procurement (20 percent).
The US Energy Information Administration, within the DOE, does periodic surveys to understand the total energy consumption and consumption across different types of buildings. Their last survey was in 2018. The previous survey had been in 2012, and the compound annual growth rate in the number of warehouses over that time was 4.0%.
Here is a look at some more key findings from the survey completed with Transporeon , as well as my interview with Transporeon CEO Stephan Sieber. As part of this research, we surveyed 106 individuals across a variety of industries and countries. Wait Times and Costs Can Add Up Quickly.
We surveyed 1,000+ GTM professionals to find out. AI adoption is reshaping sales and marketing. But is it delivering real results? The data is clear: AI users report 47% higher productivity and an average of 12 hours saved per week. But leaders say mainstream AI tools still fall short on accuracy and business impact.
PWC’s Digital Trends in Supply Chain Survey reports that 83% of manufacturers say that supply chain technologies have not delivered the expected results. This exceeds the 55% previously reported in the Supply Chain Insights surveys. References: 2023 Digital Trends in Supply Chain Survey: PwC The trend is clear.
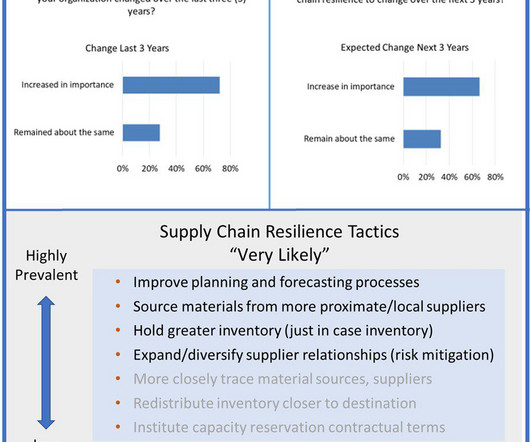
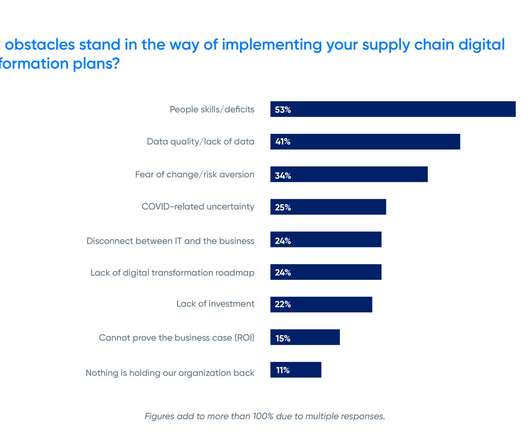
Amid this perfect storm of disruption, GEP and the North Carolina State University (NCSU) Supply Chain Resource Cooperative surveyed supply chain, procurement and IT professionals across a range of industries to gain insight into their priorities and strategies regarding supply chain resilience and optimization.
Streamlining pre-shipping efforts creates efficiency and visibility In an IDC research survey, supply chain executives agree, “visibility, agility, supply diversification, and collaboration strategies” are the top responses for companies to mitigate supply chain risk from disruption.
Insights into the North American supply chain from Descartes’ 2024 Global Transportation Management Benchmark Survey The role of transportation management has become more critical than ever as companies strive to balance efficiency, cost, and customer satisfaction.
To better understand the factors behind the decision to build or buy analytics, insightsoftware partnered with Hanover Research to survey IT, software development, and analytics professionals on why they make the embedded analytics choices they do.
Leaders surveyed in third annual ToolsGroup and CSCMP report are “extremely concerned” about external supply chain threats but lack people to make transformation succeed. From January to March 2022, CSCMP and ToolsGroup surveyed more than 300 supply chain professionals around the world.
Descartes’ 2024 Global Transportation Management Benchmark Survey shares responses from more than 630 companies, indicating there is a correlation between financial performance and the strategic importance senior management places on transportation.
This survey-based research gathers quantitative data as well as information on practices or performance drivers. This survey focuses on the current state of key practices in last mile logistics, spread across multiple industries and over 1,100 respondents. Final Thought The APQC last mile delivery survey sheds new light on a hot topic.
40% of the survey respondents said they have implemented one or more control towers, and. 40% of the survey respondents said they have implemented one or more control towers, and. Read more
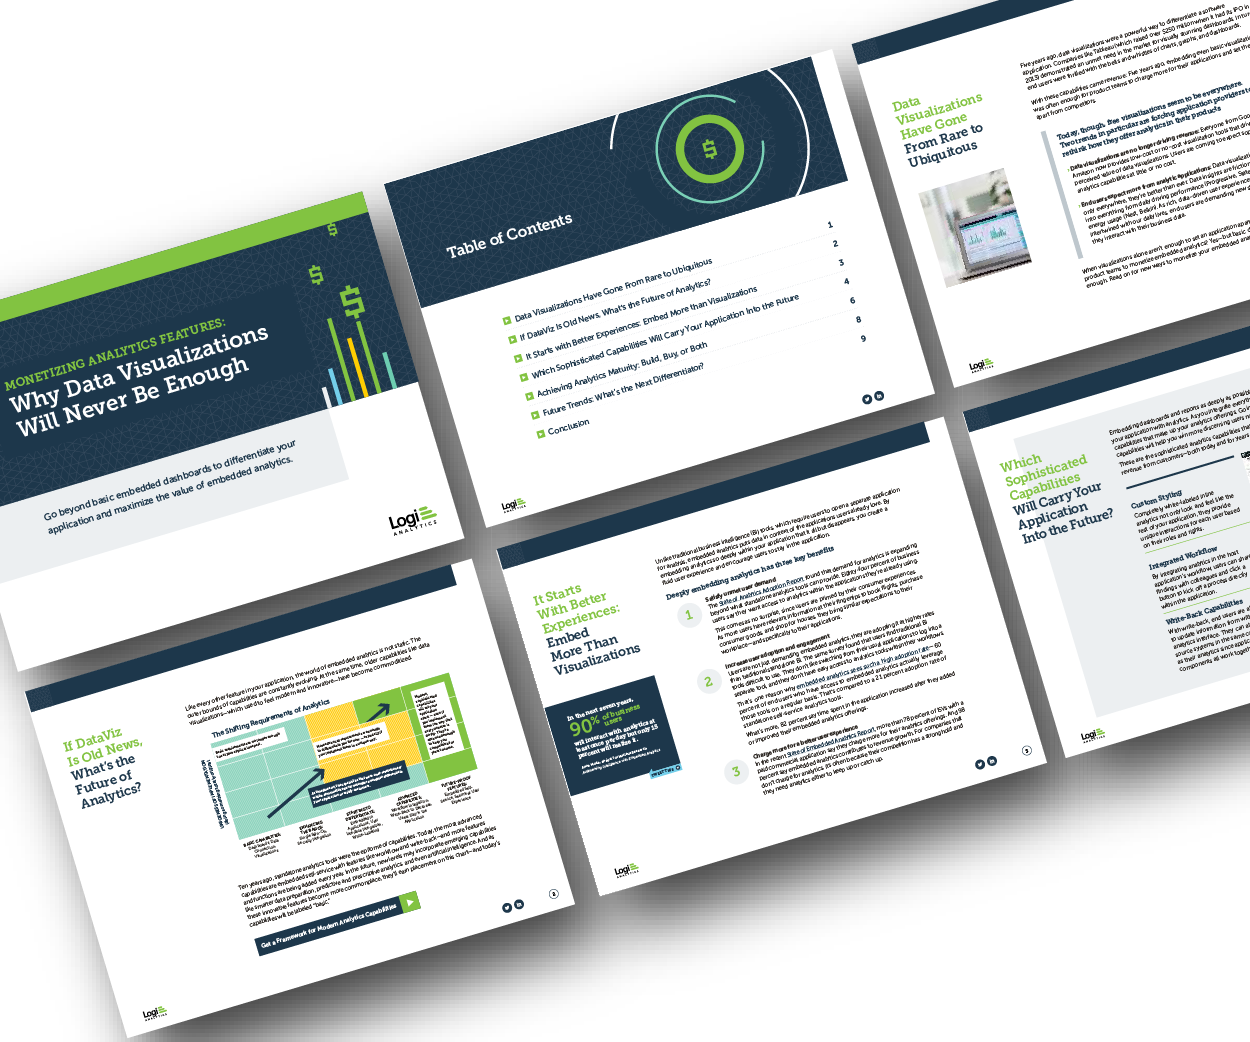
Think your customers will pay more for data visualizations in your application? Five years ago they may have. But today, dashboards and visualizations have become table stakes. Discover which features will differentiate your application and maximize the ROI of your embedded analytics. Brought to you by Logi Analytics.
Today’s article is the fourth part in a series featuring surveys from APQC on supply chain topics including environmental sustainability , last mile , and digital transformation. Survey respondents were asked to identify the top three challenges they face in implementing ESG into their supply chain.
Quantitative Survey Analysis on User Satisfaction. My recent attempt was to share a comparison of user satisfaction between technology leaders based on a survey gathered from LinkedIn survey data from my 320,000 followers. The survey was taken from the field in 2023. What is a feasible plan?
Mythos AI: Mythos AI, in partnership with Newlab and Interlake Steamship, developed an autonomous vessel for conducting port depth surveys. The collaboration underscores how cloud-based AI infrastructure can enable scalable, cross-modal improvements in resource usage and emissions control.
Just by embedding analytics, application owners can charge 24% more for their product. How much value could you add? This framework explains how application enhancements can extend your product offerings. Brought to you by Logi Analytics.
We organize all of the trending information in your field so you don't have to. Join 102,000+ users and stay up to date on the latest articles your peers are reading.
You know about us, now we want to get to know you!
Let's personalize your content
Let's get even more personalized
We recognize your account from another site in our network, please click 'Send Email' below to continue with verifying your account and setting a password.


Let's personalize your content