article thumbnail

Supply Chain Performance Declined In the Last Decade. The Question is Why?

Supply Chain Shaman

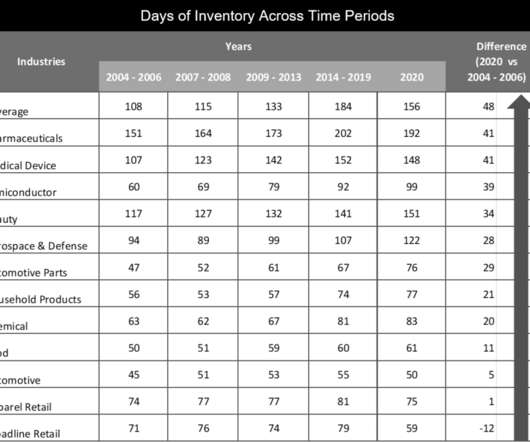
Yes, companies held more inventory (measured in days of inventory) in 2019 than at the start of the 2007 recession. Commercial and operating teams in manufacturing organizations greater than 5B$ in annual revenue were more aligned in 2007, at the beginning of the recession, than in 2020, the start of the pandemic. Alignment Barriers.

article thumbnail

What is Supply Chain Visibility and Why Isn’t It Enough?

Logistics Viewpoints

In a survey of 150 global manufacturing executives, 47% committed to improving supply chain visibility and tracking. According to the Global Supply Chain Disruption and Future Strategies Survey Report, this goal was the top-ranked planned tool investment.

Insiders

Sign Up for our Newsletter

This site is protected by reCAPTCHA and the Google Privacy Policy and Terms of Service apply.

article thumbnail

How We Stubbed Our Toe in The Evolution of S&OP

Supply Chain Shaman

Industries carried on average 32 days more inventory in 2020 than in 2007. (I Organizations can align to drive value despite the allegiance to functional metrics. Every time I published a report, he would call me and express his concern that I did not fully understand the issues of the global supply chain organization.

S&OP 195
article thumbnail

Measuring Up?

Supply Chain Shaman

The supply chain is a complex system with finite, and non-linear relationships between supply chain metrics that drive balance sheet results. We find that companies can improve one, but not two of the metrics. Teams struggle to drive improvement in both metrics at the same time. The period of 2007-2008 was the great recession.

article thumbnail

2020 Requires Big Wings and Feet

Supply Chain Shaman

After the Supply Chain Insights Global Summit , I took the time to recharge and took a month off from writing. For the global supply chain, it is a constant juggling act. No metric should be measured in isolation, and functional metrics should be replaced with the balanced scorecard metrics shown in Figure 2.

article thumbnail

Household Products Industry Stuck in Neutral and Going Backwards

Supply Chain Shaman

P&G’s rate of improvement on the Metrics That Matter was lower than the peer group. In this period, a combination of rapidly increasing stock prices, market confidence on future profits, and speculation in individual stocks, made investors overlook traditional metrics in favor of confidence in future technological advancements.

article thumbnail

The Better Goal: More Fuel Efficient Trucks or Using Fewer Trucks?

Talking Logistics

According to the press release : The proposed standards are expected to lower CO2 emissions by approximately 1 billion metric tons, cut fuel costs by about $170 billion, and reduce oil consumption by up to 1.8 miles out of its network from 2007-2010 and had increased its CWT per truck from 382 in FY 2007 to 415 in FY 2010, an 8.6