This site uses cookies to improve your experience. To help us insure we adhere to various privacy regulations, please select your country/region of residence. If you do not select a country, we will assume you are from the United States. Select your Cookie Settings or view our Privacy Policy and Terms of Use.
Cookie Settings
Cookies and similar technologies are used on this website for proper function of the website, for tracking performance analytics and for marketing purposes. We and some of our third-party providers may use cookie data for various purposes. Please review the cookie settings below and choose your preference.
Used for the proper function of the website
Used for monitoring website traffic and interactions
Cookie Settings
Cookies and similar technologies are used on this website for proper function of the website, for tracking performance analytics and for marketing purposes. We and some of our third-party providers may use cookie data for various purposes. Please review the cookie settings below and choose your preference.
Strictly Necessary: Used for the proper function of the website
Performance/Analytics: Used for monitoring website traffic and interactions
At each company, there is a relationship between the metrics of growth, margin, inventory, customer service, and asset strategy. For the purpose of this article, I will use Return on Invested Capital (ROIC) as the proxy metric to discuss asset utilization.) I never calculated and accounted for the inter-dependencies between metrics.
While the performance rankings were based on comparisons of inventory turns, operating margin and Return on Invested Capital (ROIC) for the periods of 2006-2013 and 2009-2013, the concept is that to be a supply chain leader you must outperform and drive improvement. Aligned Metrics. We find that this is true of too few companies.
Here we share the answers to the questions that we get the most often about this research: What is the source of data? We placed them in the industry that they were the most like, e.g., the primary source of revenue. We find that companies will establish metric targets in isolation and throw the supply chain out of balance.
Over the period of 2009-2015 only 88% of companies made improvement on the “Supply Chain Metrics That Matter.” (The The Supply Chain Metrics That Matter are a portfolio of metrics which correlate to higher market capitalization. Comparison of Performance and Improvement of Companies in the Chemical Industry for 2009-2015.
2009: H1N1 Outbreak in Mexico. However, the logic Cisco uses to manage the disruption is very robust and details are summarized into the infographic below, Note: metrics data is for illustrative purpose. Metrics look very simple and its kind of nice to have something like these. And according to the U.S. 2011: Thailand Floods.
Here we share the answers to the questions that we get the most often about this research: What is the source of data? We placed them in the industry that they were the most like, e.g., the primary source of revenue. Which companies were considered in the study?
When you run the graphs, there is marked difference for these companies that begins to appear in 2009. As shown in Figure 1, the cost of Texas crude has increased nearly four times in the last decade; yet, too few companies are actively modeling the trade-offs of make, source and deliver TOGETHER.
The supply chain is a complex system with finite, and non-linear relationships between supply chain metrics that drive balance sheet results. We find that companies can improve one, but not two of the metrics. Teams struggle to drive improvement in both metrics at the same time. A Look at History. Resiliency.
In our work on the Supply Chains to Admire report , we tracked the progress of manufacturing, retailing and distribution companies for the period of 2006 to 2013 and 2009-2013. We then rated companies on their ability to manage and improve a portfolio of metrics: operating margin, inventory turns and Return on Invested Capital (ROIC).
The company leverages globally sourcing strategies to buy products at a lower cost and then deploys some unique process logic to drive mass customization for retailers. Over the period of 2009-2015, only 88% of companies made improvement on the Supply Chain Metrics That Matter. (As About the Supply Chains to Admire Research.
It is data driven research: a deep analysis of performance, improvement and Price to Tangible Book Value of 320 companies across 31 industries for the period of 2009-2015. The source data for the analysis is public reporting of balance sheets and income statements. The Supply Chains to Admire analysis is now in its third year.
The winners drive improvement while posting financial results in the Supply Chain Metrics That Matter ahead of the peer group. The performance factors evaluated in the analysis are: Growth. (If you trace the year-over-year pattern, you can see that P&G made progress on inventory turns and operating margin 2006-2007, 2009-2010.
For instance, during the great recession of 2009, 85% of Chief Procurement Officers reported they had more influence than prior to the crisis, but by 2013, that influence waned significantly for two-thirds of those leaders. This list should include the business metrics that each procurement project impacts.
For instance, when a disaster such as a hurricane, a labor strike, or a bankruptcy disables key suppliers, quick-moving enterprises are able to lock in alternative sources of supply before their rivals. There is growing interest in incorporating weather forecast data from a variety of sources into supply chain planning.
28% of global retailers have tried to find alternative sourcing options due to supply chain issues (RetailNext, 2020). Source: Consultancy.UK. Image source: Fortune. As some component lead times push into 2023, the shortage is expected to last 24 months before it recedes – similar to the chip shortage of 2008-2009.
Over the period of 2009-2015, only 88% of companies made improvement on the Supply Chain Metrics That Matter. Companies passing these two tests are then analyzed against the performance factors for 2009-2015: Growth. We had silo’s and different functional areas had competing metrics that prevented progress.
The selection of metrics is based on prior work with Arizona State University to understand which metrics, in combination, correlate to market capitalization and price to book value. They used the work built together in 2004-2009 to build a course with Georgia Tech for executive training.) Why do we spend four months doing this?
It is data driven research: a deep analysis of performance, improvement and Price to Tangible Book Value of 320 companies across 31 industries for the period of 2009-2015. The source data for the analysis is public reporting of balance sheets and income statements. The Supply Chains to Admire analysis is now in its third year.
The article published in question, Knowledge sharing in interorganizational product development teams: the effect of formal and informal socialization mechanisms , was published in the Journal of Production Innovation Management in 2009.
For December 2015, retail sales were the lowest since 2009. As a result, the architecture for the EACH and chain of custody of products for eCommerce requires HADOOP and non-relational open source technologies like Apache Spark. What does this mean? I think three things: Decline in Customer Sentiment. Customers are buying less.
However, digitization really became mainstream around 2009 when there were officially more “things” than people connected to the internet. The tools supporting digitization enables the presentation of information in ways not conceived of pre-2009. Digitization began in the early 1970s with the advent of the computer.
the “inventory to sales” ratio (inventory levels divided by a month’s worth of sales) spiked in late 2008/early 2009 as the recession caught companies with way more inventory than needed versus suddenly shrinking demand. Source: Commerce Dept. Source: SupplyChainDigest. Source: Supply Chain Shaman.
Unfortunately, we find most companies are moving backwards on the Supply Chain Metrics That Matter (growth, operating margin, inventory turns and Return on Invested Capital) or are making progress on singular metrics instead of driving performance improvement on a balanced portfolio of supply chain metrics that correlate to market capitalization.
They are tactical rather than strategic, offer insufficient visibility and are limited by metrics, contract terms, and risk mitigation strategies. 3PLs and shippers each see themselves as the largest sources of innovation within their relationships. Economic losses from supply chain disruptions increased 465% between 2009 and 2011.
Stuart William was in one of my former MBA classes at NC State in 2008, and graduated into one of the worst economies ever in May of 2009. In 2009 it lost two-thirds of their sales – and lost money for four years in a row. We have a secondary source but can’t turn in less than 5 days –and we will run out before then!
Sourcing & Procurement. Sourcing & Procurement. ProcureEdge – Sourcing & Procurement. Hence there arises a need to implement a system/process that can collaborate and obtain information from various sources, analyze and help formulate strategies for a more visible supply chain. December 2009.
Sourcing & Procurement. Sourcing & Procurement. ProcureEdge – Sourcing & Procurement. Insuring that each function, including online marketing, store operations and supply chain have common objectives, metrics and aligned rewards for the coming year. Sourcing,Procurement,Contract & Spend Management (38).
Sourcing & Procurement. Sourcing & Procurement. ProcureEdge – Sourcing & Procurement. Benefits: Avoid multiple sources of truth - With single / reduced number of instances the number of databases will be less. Sourcing,Procurement,Contract & Spend Management (38). December 2009. April 2009.
Sourcing & Procurement. Sourcing & Procurement. ProcureEdge – Sourcing & Procurement. IT enablement in areas like Mobile work management, Health and Safety, Metrics monitoring (KPI) etc. Sourcing,Procurement,Contract & Spend Management (38). December 2009. November 2009. August 2009.
Sourcing & Procurement. Sourcing & Procurement. ProcureEdge – Sourcing & Procurement. In this step, the actuals are compared with the planned metrics (MAPE, forecast accuracy, bias etc.) Sourcing,Procurement,Contract & Spend Management (38). December 2009. November 2009. August 2009.
Sourcing & Procurement. Sourcing & Procurement. ProcureEdge – Sourcing & Procurement. Some of those are Cognos, iLog, SPSS, Core Metrics, Emptoris, Vivisimo and many others, as world is moving from reactive to proactive. Sourcing,Procurement,Contract & Spend Management (38). December 2009.
He joined Logistics Bureau Group back in 2009 and commenced by running the benchmarking business known as Benchmarking Success. My first step was to engage Benchmarking Success (BMS) to understand what the “best” for each business really meant from an independent source. What makes them tick? What ticks them off?
tractor fleet and sourcing 100 percent renewable energy by 2030, according to the press release. British supermarkets source peppers exclusively from Spain during the winter months. terawatt-hours of solar power would eliminate more than 112 million metric tons of carbon dioxide emissions annually, the report found.
Founded in 2009, Forerunner Ventures specializes in investing in commerce-related businesses including Warby Parker, Away, Jet, Hims, Hers, Glossier, Bonobos, and others. Product sourcing. Product sourcing is the process of purchasing or creating products that you can sell. Its latest fund (made in 2018) was $250 million.
Sourcing & Procurement. Sourcing & Procurement. ProcureEdge – Sourcing & Procurement. A further benefit of integration of these many systems is to allow organizations to effectively report on their sustainability metrics. Sourcing,Procurement,Contract & Spend Management (38). December 2009.
However, digitization really became mainstream around 2009 when there were officially more “things” than people connected to the internet. The tools supporting digitization enables the presentation of information in ways not conceived of pre-2009. Digitization began in the early 1970s with the advent of the computer.
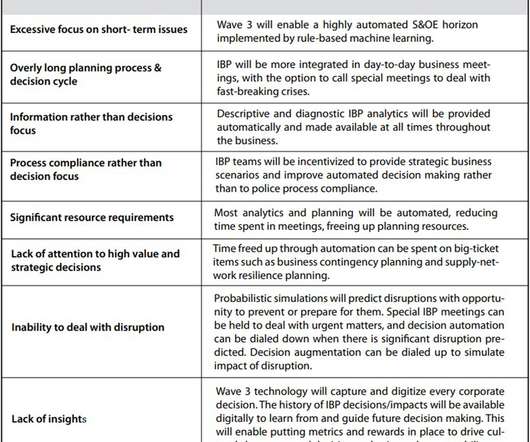
Wave 2, Advanced Planning Systems (APS), first adopted in the 1990s, facilitated a forward view of the business, integrated plans with other functions, and optimized supply-chain metrics such as forecast accuracy, inventory holdings, and customer service. The Five Key Steps of Integrated Business Management / Integrated Decision Making.
Handfield and Universidade Federal do Espirito Santo’s Dr. Marcos Paulo Valadares de Oliveira showed that an open analytics culture (OAC) strongly correlates with improved supply chain performance metrics. Supply Chain Metrics!?!? Vanity metrics and dashboards excite viewers but. What is an “Open Analytics Culture” (OAC)?
These alliances are: Source: Transplace. During the Great Recession of 2007-2009, demand decreased rapidly for container shipping, causing a chain reaction for carriers. But why the need for alliances at all? The answer lies in the state of the ocean container shipping industry over the past ten years. back to Asia).
Abby and I are writing an e-book on Supply Chain Metrics that Matter. Likewise, in today’s supply chain environment, I find that supply chain leaders favor a single function of logistics, manufacturing or sourcing. Companies that are not looking holistically at metrics are stuck. It will publish in the early summer.
In 2008-2009, nine died and hundreds became ill. The investigation into the activity at PCA began in 2009, after the U.S. The manufacturers sourced the peanut butter primarily on cost. Lora wrote the books Supply Chain Metrics That Matter and Bricks Matter , and is currently working on her third book, Leadership Matters.
We organize all of the trending information in your field so you don't have to. Join 102,000+ users and stay up to date on the latest articles your peers are reading.
You know about us, now we want to get to know you!
Let's personalize your content
Let's get even more personalized
We recognize your account from another site in our network, please click 'Send Email' below to continue with verifying your account and setting a password.


Let's personalize your content