Remove 2010 Remove Metrics Remove Sourcing
article thumbnail

Aligning Supply Chain Metrics to Improve Value

Supply Chain Shaman

In follow-up qualitative interviews, one of the largest issues with organizational alignment was metric definition and a clear definition of supply chain excellence. In my post Mea Culpa, I reference my work with the Gartner Supply Chain Hierarchy of Metrics. Error is error, but is it the most important metric? My answer is no.

article thumbnail

History Repeats Itself Without Supply Chain Leadership

Supply Chain Shaman

Despite goals to improve agility and resiliency, functional metrics for manufacturing efficiency continually throw the supply chain out of balance. The analysis covers the period from 2010 to 2019. The analysis covers the period from 2010 to 2019. The second step is to align metrics to the strategy.

Insiders

Sign Up for our Newsletter

This site is protected by reCAPTCHA and the Google Privacy Policy and Terms of Service apply.

article thumbnail

Announcing the Supply Chains to Admire for 2019

Supply Chain Shaman

Industry-by-industry, I compiled data for the period of 2010-2018. The source data for the analysis comes from Ycharts.). We selected these metrics based on correlation work with Arizona State University in 2012. The companies I work with struggle to set metrics targets. Click the link to see the detail.) Target Setting.

article thumbnail

Tell Me Why

Supply Chain Shaman

Traditionally, the focus has been on building efficient organizational silos for make, source or deliver. As a result, tor most companies, the goals are unclear and the financial metrics are not well-understood. When I started this research in 2010, I believed that P&G and Wal-Mart would meet this criteria.

article thumbnail

Rockwell Automation: Supply Chains to Admire Winner

Supply Chain Shaman

For the past five years, the team at Supply Chain Insights identified Supply Chains to Admire Award Winners by analyzing performance by peer group on the key metrics of growth, operating margin, inventory turns and Return on Invested Capital (ROIC). To decide winners, we analyze post-recession period performance of 2010-2018 by peer group.

article thumbnail

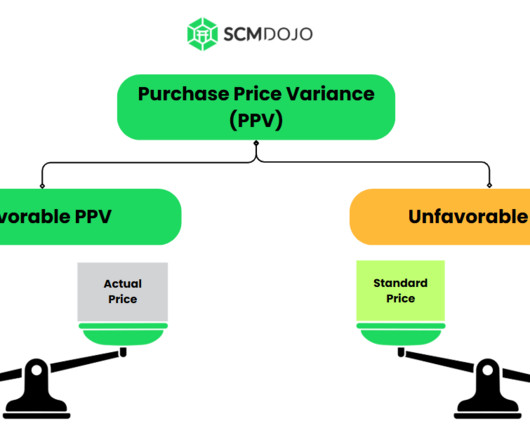
What is Purchase Price Variance (PPV) and How to Calculate it?

SCMDOJO

Introduction Gardner, (1954) and Huntzinger, (2007) define Purchase price variance (PPV) as a metric used to measure the effectiveness of cost-saving efforts by calculating the difference between the planned cost (standard pricing) allocated for purchasing activities and the actual cost incurred. worry no more! References Garnder, S.

article thumbnail

2020 Requires Big Wings and Feet

Supply Chain Shaman

No metric should be measured in isolation, and functional metrics should be replaced with the balanced scorecard metrics shown in Figure 2. To maximize value—price to tangible book, functional metrics need to be reset to focus on reliability. Average Inventory Levels by Industry over the Period of 2010-2018.