This site uses cookies to improve your experience. To help us insure we adhere to various privacy regulations, please select your country/region of residence. If you do not select a country, we will assume you are from the United States. Select your Cookie Settings or view our Privacy Policy and Terms of Use.
Cookie Settings
Cookies and similar technologies are used on this website for proper function of the website, for tracking performance analytics and for marketing purposes. We and some of our third-party providers may use cookie data for various purposes. Please review the cookie settings below and choose your preference.
Used for the proper function of the website
Used for monitoring website traffic and interactions
Cookie Settings
Cookies and similar technologies are used on this website for proper function of the website, for tracking performance analytics and for marketing purposes. We and some of our third-party providers may use cookie data for various purposes. Please review the cookie settings below and choose your preference.
Strictly Necessary: Used for the proper function of the website
Performance/Analytics: Used for monitoring website traffic and interactions
The award, based on beating the industry peer group on rate of improvement on the key metrics of growth, operating margin, inventory turns, and Return on Invested Capital (ROIC) while outperforming their peer group, is tough to achieve. The orbit chart below illustrates L’Oréal’s performance at the intersection of two metrics.
” Followed by “How are you organized, and what defines functional excellence? And, how do you tie functional excellence to corporate value?” Companies became less clear on the definition of supply chain excellence and how to implement decision support technologies. Functional Metrics.
Initially, the output was published to procurement to design strategic buying strategies. Watermelon Metrics Don’t Drive The Right Results. I love the metaphor of watermelon metrics. The issue is that traditional functional metrics drive underperformance—the greater the variability, the larger the gap.
Clear operating strategy and definition of supply chain excellence across plan, source, make and deliver. Governance. Most companies buy decision support technology, but do not redefine work to improve decisions. A shift from functional metrics to a balanced scorecard. Drives Value. S&OP is a business process.
How aligned do you believe your organization is to drive these metrics? Observations on What It Takes In the Mea Culpa post, I wrote that I used to believe that excellence in S&OP was a ratio of 60/30/10. (60% The demand latency (the time of purchase in the channel to the visibility of an order) was 2-12 weeks.
Users are accustomed to building everything in Excel and manipulating the data as needed for their own particular use, typically using static reports or spreadsheets that are siloed in specific departmental needs. A key first step is to have buy-in at the highest level of the organization. Starting at the Top.
The high-flying company had no clarity of purpose or clear governance, but the funds kept coming. Clear governance. While there is work within SAP to rethink SNC and use the assets purchased with Ariba to build multi-tier capabilities, the progress is not encouraging. Transora had a short history. Marketplace Rebirth.
There is an inverse relationship between margin and supply chain excellence. Zimmer’s strategic framework focuses on growth, operational excellence and prudent capital allocation. Leaders need to start a system to improve measurement and tie performance to buying incentives. I don’t think so. It matters more. My Challenge.
The network senses, translates, and orchestrates market changes (buy- and sell-side markets) bidirectionally with near real-time data to align sell, deliver, make and sourcing organizations outside-in. A value network governed and defined by customer segmentation and a clear understanding of what drives value for the customer.
The sad thing is that most companies will never know because they are blindly measuring the wrong metric and driving a supply-centric agenda. The days of the functional manager focused on OEE (Operational Equipment Efficiency) and POV (Purchase Price Variance) need to end. So, my reply to Peter S. So, my reply to Peter S.
Demand latency is two-eight weeks delayed from consumption purchase to translate to an order. Organizations can align to drive value despite the allegiance to functional metrics. I am shocked to see how the lack of governance–clarity on who and how to make decisions–derails well-intended processes. Mistake #3.
Environmental, Social, and Governance (ESG) considerations are no longer aspirational—they are essential. ESG adds a new layer of strategic value, directly tying environmental sustainability, ethical practices, and robust governance to operational performance and risk mitigation.
She works with supply chain leaders to take teams to higher levels of excellence and is an influencer with more than 340,000 followers on LinkedIn. How often do your purchase orders change? For example, if your supplier is on wafer-thin margins, it may be bulk purchasing in order to reduce costs, leaving it with excess stock.
In a much broader context, the byproduct of this work will be lasting innovation that informs design, production and distribution excellence for years. At the same time, start a frank discussion about which metrics matter right now. Perhaps purchase price variance and budget adherence should take a back seat to customer service.
Early challenges to IBP included a lack of an accepted academic definition, the absence of a governing body and a bias toward supply chain applications. These critics sensed a sinister “rebranding” ploy designed to get companies to purchase technology and services they already own but perhaps have not fully implemented.
Brand loyalty is no longer the driver for consumer purchasing decisions. People simply want to purchase products from businesses which provide a more transparent and streamlined service, and who deliver on their customer promise, even if it means inflated prices to obtain it.
At a recent industry conference, I asked my 80-plus audience to raise their hands if they were “OK” with the current status of their performance measurement governance practices – including Metrics Identification, Measuring, Tracking, and Controlling. Only three managers raised their hands. Lack of consistently clean data.
By infusing intelligence into every supply chain touchpoint—from sourcing to shelf—AI is driving operational excellence, customer satisfaction, and exponential growth. Create Cross-Functional AI Governance Taskforce: Align IT, operations, finance, and business to manage deployment and performance. ThroughPut.AI
There are a number of excellent reasons circular economies are desirable, including less waste and better use of limited resources. Steutermann notes, “While some metrics on sustainability already exist, they are mostly related to linear metrics, such as reducing waste to landfills or carbon dioxide emissions.
Getting good at the hand-offs in roles and governance is key. The process flows across regions and planning teams and the inherent governance of around who plans, makes decisions and provides inputs are critical to success. Buying From the Same Vendor Improves Integration. Are we clear on governance? Get Started.
How to Turn Your Data into a Strategic Asset for Business Transformation Every business generates vast amounts of data daily, from customer interactions and sales transactions to supply chain movements and employee productivity metrics. Without proper governance, organizations face a paradox of data abundance paired with insight scarcity.
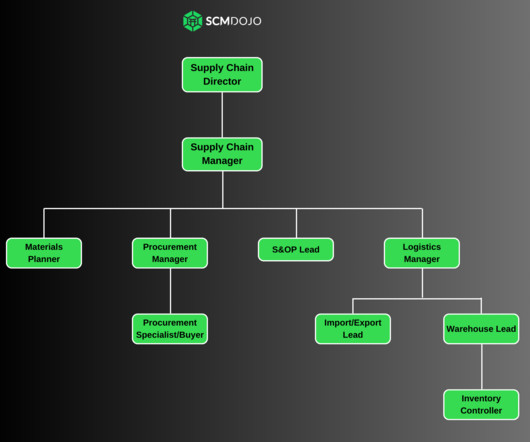
This includes providing excellent customer service, so businesses can enhance customer satisfaction and loyalty. Analyze performance metrics and implement improvements to enhance efficiency. To run the department, a supply chain manager needs certain supply chain metrics and KPIs to improve performance. Enroll Now!
” At the other end of the continuum is the argument that “ Forecast error is the most important metric to improve.” Most demand planning happens in Excel Ghettos not in the expensive technologies implemented in 90% of manufacturing companies. Planning at companies varies by governance and cultural DNA.
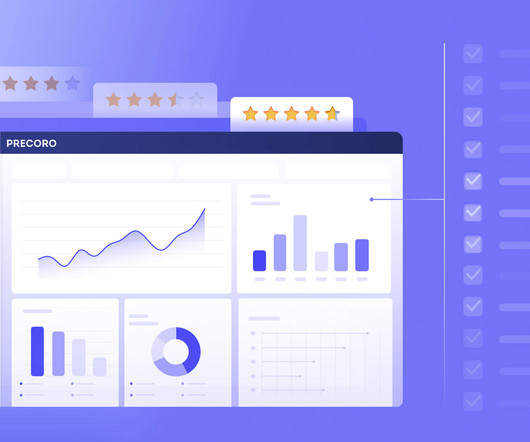
An online procurement system, also known as e-procurement software, is a digital platform designed to streamline and automate the buying process within an organization. At its core, an online procurement system centralizes purchasing activities. At its core, an online procurement system centralizes purchasing activities.
As I settled into the job and started learning, and studying, the various Supply Chain metrics I was surprised when I looked at the Inventory Turnover performance of the company. First I would talk with the 3 main people in charge of the Inventory Management and Procurement buying functions within the company. There were no targets.
Another technique you can use is to audit existing relationships with suppliers to ensure transactions are running as smoothly as possible – a method used by business and government organisations alike. Setting reorder points for the most frequently purchased items can help significantly improve inventory efficiencies and save costs.
While on the surface it is true to say that in most organizations inventory is a highly visible dimension of Supply Chain performance impacting company accounts and a key reportable metric of business performance. Foundational excellence in People, Process and Systems capability needs to underpin the deployment of the model.
Past leadership titles include Chief Procurement Officer at both Lucent Technologies and Micron Technologies, in addition to other leadership positions as Vice-President Supply Chain Management, Operational Excellence Executive, and Chief Strategy Officer. The details and magic of Excel analyses.
Improving Business Operations with Digital Processes At the heart of operational excellence is the ability to optimize workflows through digital process automation. The development of digital governance frameworks helps enterprises stay within the legal boundaries while striving for operational excellence.
What is digital governance and stewardship? We created a visualization platform to focus on internal operational, and customer-facing metrics, which is NOT part of R&D’s scope of work – so we not on your turf.” Our goal was not to move to “Excel on steroids” but rather we wanted some level of control.
For many people who work in Supply Chain Management, or for those on the outside, it functions on the foundation of processes, formulae, and metrics. A grounding in all of these areas and disciplines is excellent and mandatory for anyone looking to work in Supply Chain. Creating a High Performance Organization! Infographic).
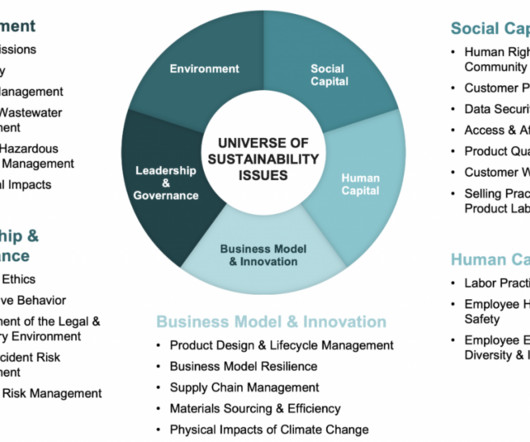
Given that suppliers account for the majority of risk in areas such as GHG emissions, human rights abuses, and gaps in corporate governance, it is critical that companies explicitly target ESG goals in their supply chain. How will you improve supplier buy-in? Often, these sustainability goals center on a company’s internal operations.
Given that suppliers account for the majority of risk in areas such as GHG emissions, human rights abuses, and gaps in corporate governance, it is critical that companies explicitly target ESG goals in their supply chain. Secure Buy-In. How will you improve supplier buy-in? Source: sasb.org. Source: sasb.org. Define Success. .
Instead, the buying company should be aware of “hidden costs” to the contract, which often pop up unexpectedly once the contract is in full swing. What are the key metrics that are going to determine success? If the buying company does have to exit, they may want to own those co-IP rights to use with the next supplier.
Resilinc’s Rick Freeman weighs in on the future opportunities for high-tech and semiconductor companies Despite the stabilization of the high-tech and semiconductor supply chain, the industry still faces pressure due to ongoing import/export restrictions and changing regulations governing semiconductor production and sourcing.
Procurement: Automated Procurement Processes AI enhances procurement by automating supplier selection, contract management, and purchase order processing. Measuring Automation Success Evaluating the effectiveness of business process automation through AI requires a focus on specific metrics and their influence on organizational goals.
Tier I Government ERP Systems: These solutions primarily support large federal agencies and their accounting, procurement and HR needs. . Tier II Government ERP Systems: These focus mainly on the needs of state and local governments. . Tiers include: Tier I ERP Systems: These support large, global enterprises. Data Services.
Similarly, meeting customer demands builds customer satisfaction and loyalty, increases the likelihood of repeat purchases, and usually leads to more sales. If you are unable to meet this metric with your current fulfillment solution, you’ll probably need to switch methodologies. about picking and packing fees).
Limited reporting: QuickBooks lacks deeper business insight reporting than surface-level metrics, meaning evidence can’t be produced for certain quality control, profitability, and efficiency decisions. Consider key factors such as cost, integration capabilities, and your physical location before making any purchases.
The What and Why of AI Tools for Supply Chain There is a reason why everyone is talking about AI tools and why people are driven to make impulsive purchases of AI-powered tools. Step 3 – The Metric Selection phase This phase involves identifying key metrics that will help track the actual impact of AI. Read it all here.
Now it is only a matter of test buying products through unauthorized channels to recognize where the supply chain leakage is coming from. So I asked, “How about we make our employee the number #1 and fortify them better to radiate excellence to the customer as transferred effect?” Some strategies for an excellent supply chain are: 1.
Yet there’s a proactive approach that addresses the high cost of healthcare: value-based purchasing (VBP). VBP also improves patient satisfaction by fostering greater collaboration among healthcare providers and making the patient experience one of the key evaluation metrics for hospitals.
In other words, many supply chain and purchasing solutions looks at historical transaction activity (what happened in the past and is captured in our ERP systems). Organizations are constantly going through re-organization events, trying to develop the right governance mechanisms that will enable agile decision-making and responsiveness.
Making sense of government policies in different jurisdictions added to the requirement for speed. We have clear metrics that talk about payments on time to suppliers, or, if they raise an issue, how quickly is that getting resolved. We have clear metrics and a good sense of how in sync we are with our supplier base.”.
We organize all of the trending information in your field so you don't have to. Join 102,000+ users and stay up to date on the latest articles your peers are reading.
You know about us, now we want to get to know you!
Let's personalize your content
Let's get even more personalized
We recognize your account from another site in our network, please click 'Send Email' below to continue with verifying your account and setting a password.


Let's personalize your content