
Some COVID19 Data Analysis Basics – New Events, Cum Events, and Logarithms
Arkieva
APRIL 14, 2020
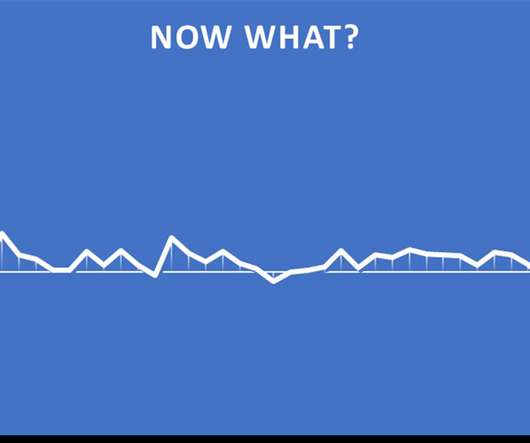
We see graphs of COVID-19 events on a regular basis these days. Two common ones are bar charts for daily new events (COVID-19 cases, hospitalizations, deaths) and the “sweeping curve” to capture a cumulative number of events. Additionally, log transformations are mentioned.


Let's personalize your content