This site uses cookies to improve your experience. To help us insure we adhere to various privacy regulations, please select your country/region of residence. If you do not select a country, we will assume you are from the United States. Select your Cookie Settings or view our Privacy Policy and Terms of Use.
Cookie Settings
Cookies and similar technologies are used on this website for proper function of the website, for tracking performance analytics and for marketing purposes. We and some of our third-party providers may use cookie data for various purposes. Please review the cookie settings below and choose your preference.
Used for the proper function of the website
Used for monitoring website traffic and interactions
Cookie Settings
Cookies and similar technologies are used on this website for proper function of the website, for tracking performance analytics and for marketing purposes. We and some of our third-party providers may use cookie data for various purposes. Please review the cookie settings below and choose your preference.
Strictly Necessary: Used for the proper function of the website
Performance/Analytics: Used for monitoring website traffic and interactions
The relationship between corporate financial performance and supply chain metrics was complex; and in my first attempts, I was unable to derive a correlation. I wanted to better understand which metrics truly mattered. However, as many of you know, I am stubborn. I wanted to know more. I hungered to know the patterns. Definitions.
This work is based on a collaborative project with Arizona State University. I am hearing it again in my interviews for the book Metrics That Matter. My question for the Arizona State team was, “ How do I best define a technique that can represent the randomness of this pattern?” We have stubbed our toes.
It is a quest and the subject of my next book, Metrics That Matter , that will publish in September, 2014. This week, I am finalizing an agreement with Arizona State University to fund a PHD student in statistics under the guidance of George Runger to try to finish the work. .” As I shuffle along, I am not sure. I shake my head.
Supply Chain Improvement is based on the work that we completed with an Arizona State University Operations Research team to determine the Supply Chain Index. Aligned Metrics. This report, Supply Chains to Admire , compares the progress of 200 companies within their respective peer groups on both performance and improvement.
As a result, the metrics have to be viewed together as a pattern over time. In the journey, the supply chain leader needs to improve the potential of a portfolio of metrics. The metrics of growth, Return on Invested Capital, Inventory Turns and Operating Margin have the highest correlation to market capitalization.
One of my stark realizations this year is that smaller companies are beating larger and often more established companies on growth metrics, inventory turns, operating margin, and Return on Invested Capital (ROIC). (In The metrics selection resulted from work with Arizona State University in 2013.) My takeaway?
Transportation metrics saw little change in May as capacity, utilization and pricing remained in expansion territory, according to a monthly survey of supply chain professionals. If the spread between these two metrics remains this high, it could spell trouble for the overall economy.” Upstream firms (56.5)
On September 9–11, 2014, 110 supply chain visionaries will gather in the desert at the Phoenician Hotel in Scottsdale, Arizona to think differently and define the future of supply chain. It is needed. Today, 90% of publicly-traded companies are stuck at the intersection of operating margin and inventory turns.
We selected these metrics based on correlation work with Arizona State University in 2012. The winners drove long-term value (measured by market capitalization) while outperforming on the portfolio of metrics shown in Figure 1 and driving improvement faster than their peer groups. Celebrating Success. Target Setting.
Note to the reader: we selected these metrics for the balanced scorecard for the analysis after work with Arizona State University to understand which metrics, in combination, most closely correlated with market capitalization. Consider the role of functional metrics and the lack of alignment with the corporate scorecard.)
I have taken myself off the road to write the book Metrics That Matter. You just do not see the patterns of the interrelationships of metrics in an Excel spreadsheet. The one next week focuses on the work that we have been doing on the Supply Chain Index with Arizona State University (ASU). It is a slow week. It is tedious.
I have learned that supply chain systems are more complex than I originally thought, and that the relationships between supply chain metrics are nonlinear. After three years of research, I have just refined the methodology to start to pull the trends. It takes more than one or two respondents from a company. We hope to see you there!
We have found that supply chain metrics are gnarly and complicated.During The Index is a methodology developed by Supply Chain Insights LLC, in cooperation with the Operations Research Team at Arizona State University (ASU), to gauge supply chain improvement. We named it the Supply Chain Index. Our aim was to maintain a 3 to 3.5
In SIOP, accountability is a huge part of achieving desired outcomes, improving monthly metrics and satisfying the customer needs. Madeline received a Bachelor of Science in Supply Chain Management and a Bachelor of Science in Marketing from Arizona State University. MORE FROM THIS EDITION. Your Sales Plan is NOT a Forecast!
It is important to benchmark forecast accuracy and similar supply chain metrics against your peers. It turns out the Super Bowl happened on February 12 th in Glendale, Arizona. Doing this, increases the benefits. Companies need to understand how much it is realistically possible to improve their forecasts.
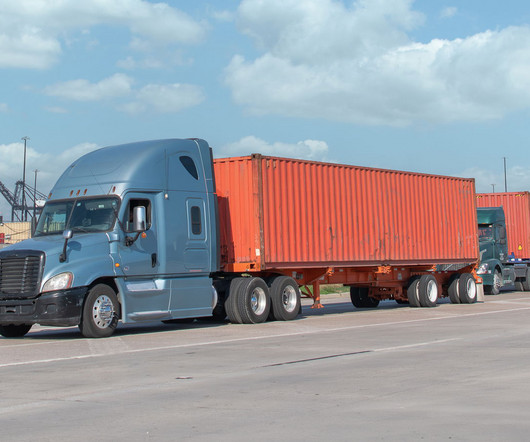
To demonstrate, one California autonomous vehicle company, TuSimple, tested the efficacy of long-haul driverless vehicles in a recent trek from Nogales, Arizona to Oklahoma City, shaving 10 hours (42%) off of what would otherwise be a 24-hour trip. Keep Your Eyes on the Road.
Pick five-to-seven balanced metrics and hold all functions accountable to these corporate metrics. Next week, in Arizona, 120 supply chain leaders will be meeting to network on the Future of Supply Chain 2030. Communicate the balanced scorecard for the team through clear leadership communication and stay the course.
I began analyzing correlations of groups of metrics to market capitalization and found that the most significant correlation was between market capitalization and growth. Initially, I worked with Arizona State statistics professors and graduate students to correlate market factors to 2006-2012 data.)
To make the list, companies out-performed their peer group on operating margin, inventory turns and Return on Invested Capital while driving significant improvement in financial metrics over the period.Supply Chain Improvement is based on a detailed analysis calculated factors for balance, strength and resiliency.
The methodology was determined with Supply Chain Insights and Arizona State University in 2014. For this reason, a company shows greater balance if the improvement of one of the metrics does not cause a negative effect on the other. P&G Balance Metrics. P&G Strength Metrics. Improvement. 0.03)/(0.03)) + ((0.12-0.13)/(0.13))
The selection of metrics is based on prior work with Arizona State University to understand which metrics, in combination, correlate to market capitalization and price to book value. Why do we spend four months doing this? We aim to move companies from a cost-based agenda to drive value in their supply chains.
Nine out of ten companies are stuck: unable to make progress on a portfolio of supply chain metrics. The simulation game is tied to the work we are doing with Arizona State University’s Operations Research group on the Supply Chain Metrics That Matter. One focus to create content for supply chain visionaries.
February 2025 Logistics Managers Index Report The Logistics Managers Index Report is compiled by researchers at Arizona State University, Colorado State University, Rochester Institute of Technology, Rutgers University and the University of Nevada Reno , and in conjunction with the Council of Supply Chain Management Professionals (CSCMP).
Planner A good supply chain software solution must first identify such cases where the semi-automatic (human involvement) approach is recommended, then be able to quantify the appropriate metric, which solution path is better, and finally notify the right individual to intervene quickly enough to make a difference.
When I was Materials Manager at Maricopa County, Arizona, the second largest county in the country, I introduced Vendor Managed Inventory. Supplier Quality Management: What it is, 5 Key Metrics to Know & a 4 Step Supplier Evaluation Process. These metrics should be reviewed frequently to ensure supply chain success.
To build this model, I flew to Arizona to develop it with Carol Ptak of the Demand-Driven Institute. Lora has written the books Supply Chain Metrics That Matter and Bricks Matter , and is writing her third book, Leadership Matters. Carol and I have been on different, but similar journeys.
Network with your peers on the insights and relax under the Arizona skies as you wrap up a couple of intense days. Lora has written the books Supply Chain Metrics That Matter and Bricks Matter , and is currently working on her third book, Leadership Matters. Network with Leaders. It is unlike any other conference.
We are systemically evaluating each industry in the Supply Chain Insights Metrics That Matter series of reports. Network with your peers on the insights and relax under the Arizona skies as you wrap up a couple of intense days with your peers at the final reception. At Supply Chain Insights , this is our passion. Network with Leaders.
I just returned from the highly engaging and inspiring Gartner Supply Chain Executive Conference in Phoenix, Arizona. Simon advocated that traditional metrics such as on-shelf availability (OSA) will need to be augmented with the likes of online availability (OLA). Here are some key takeaways from the Gartner supply chain event: 1.
Taiwan Semiconductor Manufacturing (TSMC), the company that makes the majority of latest-generation chips for Apple products, has committed to increasing capacity by spending $100 billion across the next three years, and building new factories in Arizona and Japan. Wall Street Journal ). Deloitte Global). Wall Street Journal ). Deloitte ).
The Logistics Managers Index Report® , compiled by researchers at Arizona State University, Colorado State University, Rochester Institute of Technology, Rutgers University and the University of Nevada Reno , and in conjunction with the Council of Supply Chain Management Professionals (CSCMP) , reported a September value of 61.4,
Network with your peers on the insights and relax under the Arizona skies as you wrap up a couple of intense days with your peers at the final reception. Lora has written the books Supply Chain Metrics That Matter and Bricks Matter , and is currently working on her third book, Leadership Matters. Network with Leaders.
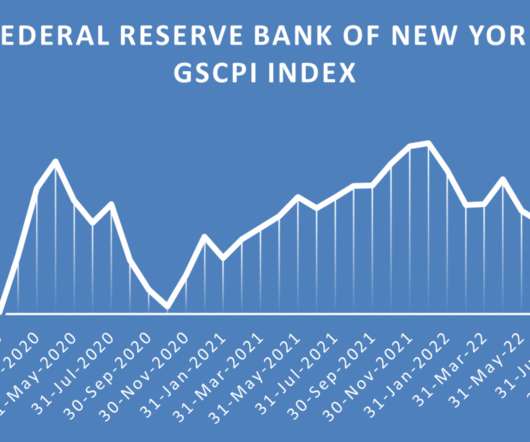
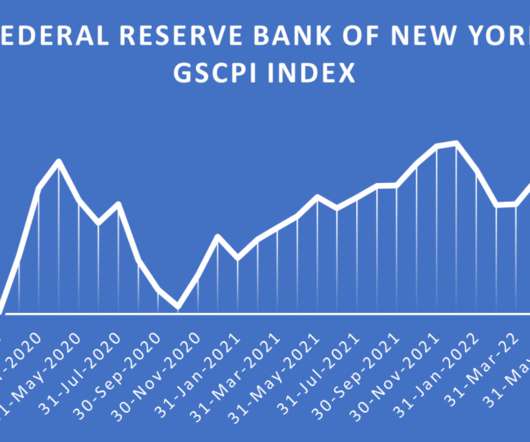
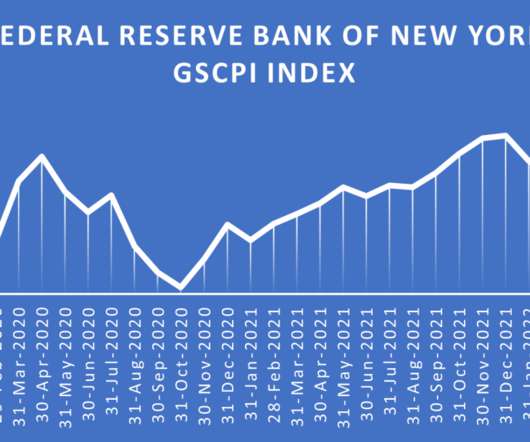
not only described as a “ significant rate of contraction ,” but also the first time that this particular metric has reached such a low level. Supply Chain Matters highlights this week’s release of the U.S. Logistics Managers Index (LMI) that dropped to an all-time low for May 2023. Consequently, transportation prices reportedly declined 8.9
According to the June report summary , the primary driver of the latest decline was the inventory metric, which reportedly contracted 6.5 Consequently, the warehousing capacity metric increased a reported 6.8 Both metrics contributed to the overall contraction in the LMI along with contracting price levels for transportation.
The Logistics Managers Index Report ®, compiled by researchers at Arizona State University, Colorado State University, Rochester Institute of Technology, Rutgers University and the University of Nevada Reno , and in conjunction with the Council of Supply Chain Management Professionals (CSCMP) , reported a July 2022 value of 60.7,
We made it about four meta metrics: SaaS ARR, customer success, associate engagement, and innovation. As we embark on our journey ahead, our domicile in the Sonoran Desert in Arizona implores us in the foreground. Each day we are witness to majestic skies that evoke limitless possibilities.
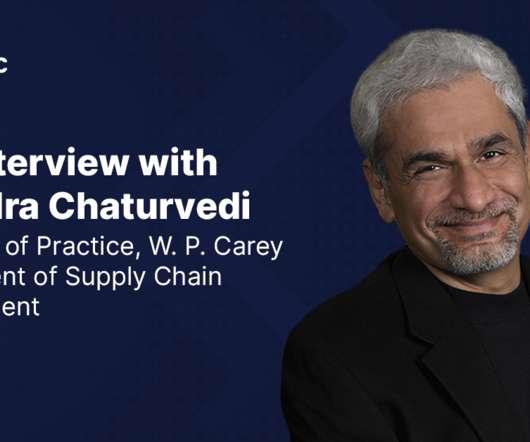
One of those voices is Hitendra Chaturvedi, professor of practice in supply chain management at Arizona State University’s W. Chaturvedi: So far this year, Ohio, Arizona and Tennessee have seen the most job announcements associated with reshoring. Carey School of Business. Resilinc: What’s the current status of reshoring manufacturing?
The Logistics Managers Index Report ®, compiled by researchers at Arizona State University, Colorado State University, Rochester Institute of Technology, Rutgers University and the University of Nevada Reno , and in conjunction with the Council of Supply Chain Management Professionals (CSCMP) , reported an April 2022 value of 69.7
In July, TSMC had to postpone the plant opening in Arizona until 2025 due to labor shortages. This is part of a larger dilemma across the industry—is it better to build new fabs or renovate aging fabs ? Both are costly and time-consuming endeavors. Labor shortages are also causing factory disruptions.
While progress was indicated against key business performance metrics, investors prompted a reported 25 percent decline in the company’s stock value. Rivian Automotive Last week, Rivian Automotive reported on the fourth quarter and full year financial performance that disappointed company investors.
Another highlight was a presentation by Dr. Robert Handfield from NC State and Dr. Thomas Choi from Arizona State University, taking an in-depth look at counterfeiting in the supply chain. I thought it was a beautiful way to sum up the meaning of leadership.
As rates continue to fall, industry metrics are beginning to reflect a new reality for the transportation market. for December, marking the metric’s fastest decline ever recorded. Walmart now offers customers drone delivery service through these vendors in Arizona, Arkansas, Florida, North Carolina, Texas, Utah, and Virginia. .
Walmart previously scaled back its drone deliveries in 2024, when it ended the service in Utah, Arizona and Florida, in favor of focusing on remaining operations in Dallas-Fort Worth, Arkansas and Virginia. Eligible products include fresh produce, household essentials and various snack foods.
To give you an idea of what this is doing, the classic retail metrics, “same store sales” and “sales per square foot”, are no longer being reported by Macy’s department stores. This is largely driven by the emergence of e-commerce, and in the process, is turning traditional business models on their heads.
We organize all of the trending information in your field so you don't have to. Join 102,000+ users and stay up to date on the latest articles your peers are reading.
You know about us, now we want to get to know you!
Let's personalize your content
Let's get even more personalized
We recognize your account from another site in our network, please click 'Send Email' below to continue with verifying your account and setting a password.


Let's personalize your content