This site uses cookies to improve your experience. To help us insure we adhere to various privacy regulations, please select your country/region of residence. If you do not select a country, we will assume you are from the United States. Select your Cookie Settings or view our Privacy Policy and Terms of Use.
Cookie Settings
Cookies and similar technologies are used on this website for proper function of the website, for tracking performance analytics and for marketing purposes. We and some of our third-party providers may use cookie data for various purposes. Please review the cookie settings below and choose your preference.
Used for the proper function of the website
Used for monitoring website traffic and interactions
Cookie Settings
Cookies and similar technologies are used on this website for proper function of the website, for tracking performance analytics and for marketing purposes. We and some of our third-party providers may use cookie data for various purposes. Please review the cookie settings below and choose your preference.
Strictly Necessary: Used for the proper function of the website
Performance/Analytics: Used for monitoring website traffic and interactions
According to research by Ernst & Young LLP, the global consulting firm, as the Covid crisis recedes, supply chain executives are losing the strategic gains they made with their C-suite counterparts. The EY research suggests that at many companies, that opportunity is receding. What gets measured affects what gets prioritized.
It will be tricky to drive change because they are likely the CEO’s “dashboard metrics”. Many measurements are sacred to the board or other metric owners. Feel free to refer the metric owner to point number 3, after you have developed a meaningful alternative.
To stay ahead of the curve, effective demand planners must track the right metrics that can help curtail possible demand planning issues ahead of time. Top 10 Demand Planning Metrics You Should Have on Your Dashboard [Infographic] was first posted on January 29, 2019 at 2:07 pm.
But in fact, all the metrics must be in balance,” says Lora Cecere from Supply Chain Insights. The analyst was joined by Bram Desmet, managing director of Solventure, to present her latest book, Supply Chain Metrics that Matter, in Brussels on 18 March 2015. They are often measuring individual metrics versus the whole,” states Cecere.
Just by embedding analytics, application owners can charge 24% more for their product. How much value could you add? This framework explains how application enhancements can extend your product offerings. Brought to you by Logi Analytics.
On-time-in-full performance of suppliers and scorecards where multiple KPIs are combined. Customer Satisfaction scores side by side with the service level and availability metrics. and Master of Engineering degrees in Operations Research and Industrial Engineering from Cornell University. Yosun holds B.S.
These goals can be expressed as key performance indicators (KPIs) – relevant functional metrics that can be tracked regularly to make sure that the business makes purchases in an efficient way. We have selected 5 fundamental KPIs that purchasing managers should consider.
One such tool is the Logistics KPI Dashboard Excel Template, which provides data on key metrics and helps identify areas for improvement. This customizable Excel tool provides a clear definition and measurement of KPIs, helping you keep your targets SMART and drive continuous improvement.
Space utilization, or vehicle fill, is a critical metric that can be measured in various ways: Pallet numbers and height: While common, this method can be misleading depending on cargo density. Research indicates that a significant portion of a truck’s time is spent idle or empty (McKinnon and Ge, 2004; IGD, 2003).
In fact, SYSPRO research revealed that 60% of businesses were impacted by supply chain disruptions during the pandemic. can be measured to define this metric. Manufacturing Cycle Time : This metric is most accurately obtained using real-time monitoring with a Manufacturing Execution System (MES). Warehousing KPIs.
MEASURING CARRIER PERFORMANCE Overall and perhaps not surprisingly, the council recommends that both objective and subjective metrics be put in place to measure the performance of MLOs and carriers. Most companies outsource >50% of their logistics services and we are often challenged with escalating logistics rates with poor reliability.
Blog Expert Advice 8 min read 12 Jun 2023 By Taulia Share: Share via linkedin Share via twitter Share via facebook Share via email Copied Copy page URL to clipboard 10 supply chain KPIs and metrics to track We’ve listed the 10 top supply chain KPIs you can use to measure your supply chain performance and find opportunities for optimization.
According to research conducted by BigCommerce , the top three factors that influence consumers’ online purchasing decisions are convenience, cost and free shipping. Taking the time to research and evaluate technology solutions to find the right solutions to meet the company’s requirements is time well-spent.
While technology offers immense potential, its practical application and impact on fuel savings require further research. Logistics KPI Dashboard is an essential tool for Logistics & Supply Chain Managers. Moreover, they help them track their performance against key metrics and identify areas where they can improve.
Whether you KPI them on Turnover or Profit Margin, having them buy into OTIF is crucial to managing the customers’ expectations.” ” Purchasing – “The KPI most used in Purchasing Departments is Stock Turn. Retailer compliance initiatives can lead to efficiency,” HighBeam Research, 1 October 2003. [3]
Shipment Tracking & Monitoring: Tracks shipments in real-time, monitors carrier performance against agreed-upon metrics, and identifies potential delays. To run the department, a logistics analyst needs certain logistics metrics and KPIs to improve performance.
There have been several significant research projects from a variety of organizations such as universities , consultants, and service providers, as well as research firms about this very issue. So those assessments should result in some form of reasonable KPI goal setting.
However, we can at least summarise a few of the best practices here, to give you a jumping-off point for further research and introductory discussions with your project team. Furthermore, many of them might not be actionable in your business—or only actionable when results are combined with other specific metrics.
Don’t just look at what your competitors are doing, research trends too. Choosing an ERP solution based solely on the individual goals and KPImetrics of key stakeholders today can result in a suboptimal solution in the years to come. When you ask, “Will my company exist in 10 years?” it’s worth doing a lot of digging.
Unlike FMCG, the launch of a new product in the hi-tech industry requires the investment in research and development quite extensively. They use the global level KPI to ensure that each player in the same supply chain is measured the same way. Life cycle of technology products is getting shorter and shorter every day.
LNS Research blogger Mark Davidson said, “When it comes to metrics, it’s often said that what gets measured gets done.”. Mark also writes: “Metrics that have the attention of business and manufacturing leaders tend to be those that get measured and improved upon by their employee teams.”. Metrics for Action.
Forecast Accuracy and Bias are two of the key KPI s we monitor monthly basis, we also investigate root causes and continuously strive for improved forecast quality. Research on Supply Chain Finance. Our goal is to help companies take supply chains to the next level. We write for the business visionary.
Armed with a good understanding of the scope of transportation services required, the Procurement Team can proceed to conduct Market Research to identify potential service providers who are able to meet the transportation services required. Contracting / Award Pricing Terms and Agreement Service Level Agreement (SLAs) (E.g.,
Shrinkage impacts profitability and operational efficiency, which makes it an essential metric for businesses to track, while actively finding means to prevent it. Make inventory shrinkage a measurable KPI While some inventory shrinkage is inevitable for every merchant, that doesn’t mean it has to go unchecked.
Naturally, the first part of this task will be to research and clarify those key trends. Then, you can analyse your current supply chain capabilities using the research results and your data concerning customer needs. Step 3: External Benchmarking and Competitor Research. Probably not.
Whether you are starting your research or looking to enhance your knowledge, this course offers essential information for that purpose. Given the current market dynamics, having accurate data and information becomes even more critical as you enter supplier negotiations. #3.
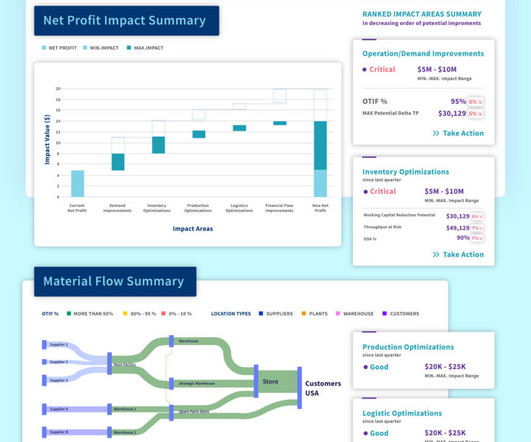
But what are the Key Performance Indicators (KPI) in supply chain management that you need to look at from a financial lens? But what you can’t miss out are the supply chain metrics outlined on the right hand side which influence these finance metrics. These directly affect business performance. Here’s how.
Shipment Tracking & Monitoring: Tracks shipments in real-time, monitors carrier performance against agreed-upon metrics, and identifies potential delays. To run the department, a logistics analyst needs certain logistics metrics and KPIs to improve performance.
With a great client team, it was very successful and involved multiple international geographies, IT, some re-org, and KPI movement. Our research and experience shows that Portfolio Review is still an untapped opportunity for most companies to include in the process. SCT: How would you describe your personal passion for S&OP?
Our research with supply chain professionals at consumer goods companies found that 55% consider On Time and In Full (OTIF) orders, or so called “perfect orders,” one of their top three KPIs. That’s the highest percentage out of all metrics we asked about, including On Shelf Availability (37%) and forecast accuracy (34%).
The topic of procurement analytics was covered in-depth at our last SCRC meeting in December, and the research paper “Procurement Analytics: Enabling the Journey to Value” that I developed with IBM around this meeting is also posted on IBM’s website. Think of a dashboard of a vehicle.
When considering what to tackle first, businesses and their supply chain management and manufacturing operational teams should initially have a clear understanding of their supply chain and/or plant level metrics that need to be improved in both current and likely future business and performance needs. All rights reserved.
the ability to meet performance metrics, . The ability to effectively manage cycle times is a crucial KPI that collaborative robotics solutions can help achieve. The specific needs of the warehouse should be taken into careful consideration, including: the likelihood of impacting productivity, . how easy it is to deploy, .
Research suggests tech transformation has led to positive impact on factors like cost, employee experience and revenue streams. The dashboard offers an overview of over 200 operational metrics, including costs, CO2 emissions, and returns. Uncompromised Security: With cyber threats looming large, Locus prioritizes security.
Supply Chain @Mr_Supply_Chain Deep customs insights, landed cost analysis, customs delays, ports, product level analysis Chris rubio @cm_rubio Transparency Complete transparency of Available To Promise Date, Landed Cost, and ESG metrics for the entire Procure-To-Pay lifecycle at the piece level. Bad design also hurts visibility.
However, we can at least summarise a few of the best practices here, to give you a jumping-off point for further research and introductory discussions with your project team. Furthermore, many of them might not be actionable in your businessor only actionable when results are combined with other specific metrics.
Once you have a strategy and have spent some time researching products, it’s time to acquire the goods and services your organization has been vetting. Market research. Once you have conducted a detailed spending analysis and identified which suppliers bring the greatest value to your business, it’s time to conduct market research.
Implementing the right set of Key Performance Indicators (KPI)s can provide a simple and effective means to achieve these objectives. Unfortunately, though, AP decision makers often struggle to identify the appropriate KPIs and lack the necessary tools to track them effectively. per invoice.
Either way, the first thing you should do is establish metrics and KPIs. Invest in good software early on to give your business the best chance at success. Supply chain planning strategies Supply chain planning can be tackled all at once or piecemeal depending on the size of your team.
Naturally, the first part of this task will be to research and clarify those key trends. Then, you can analyse your current supply chain capabilities using the research results and your data concerning customer needs. Ideally, though, evaluating your position against competitors should not solely be a KPI benchmarking exercise.
Those were the key findings from Supply Chain Movement’s research into the implementation of S&OP software in Europe. 36 | Roundtable Operational Transparency: Getting the KPIs right. 34 | Facts & Figures: S&OP strategy and trends.
What is the Role of Performance Tracking and Metrics in Supply Chain Analytics Software? Performance tracking and metrics play a crucial role in the success of any supply chain. These dashboards provide a clear and concise overview of key metrics, allowing businesses to monitor their performance anytime.
Balanced Scorecard: A system of performance measurement using a structured combination of metrics. D Days of Inventory: A metric revealing the average time a company holds its inventory (in days) before selling it. KPIs are linked to target values, so that the value of the measure can be assessed as meeting expectations or not.
Proxima’s research into the state of digital marketing spend has found that many companies are ineffectively spending between 40 and 60 percent of their digital budgets , with most wastage coming from non-human traffic and poor viewability/placement.
We organize all of the trending information in your field so you don't have to. Join 102,000+ users and stay up to date on the latest articles your peers are reading.
You know about us, now we want to get to know you!
Let's personalize your content
Let's get even more personalized
We recognize your account from another site in our network, please click 'Send Email' below to continue with verifying your account and setting a password.


Let's personalize your content