This site uses cookies to improve your experience. To help us insure we adhere to various privacy regulations, please select your country/region of residence. If you do not select a country, we will assume you are from the United States. Select your Cookie Settings or view our Privacy Policy and Terms of Use.
Cookie Settings
Cookies and similar technologies are used on this website for proper function of the website, for tracking performance analytics and for marketing purposes. We and some of our third-party providers may use cookie data for various purposes. Please review the cookie settings below and choose your preference.
Used for the proper function of the website
Used for monitoring website traffic and interactions
Cookie Settings
Cookies and similar technologies are used on this website for proper function of the website, for tracking performance analytics and for marketing purposes. We and some of our third-party providers may use cookie data for various purposes. Please review the cookie settings below and choose your preference.
Strictly Necessary: Used for the proper function of the website
Performance/Analytics: Used for monitoring website traffic and interactions
AI in Procurement: Enhancing Sourcing and Supplier Management Procurement has traditionally relied on human expertise, manual comparison of supplier options, and analysis of past performance. Lets examine critical domains, review implementation considerations, and discuss realistic expectations for adoption and outcomes.
The comparison of dissimilar companies in a four-box model is meaningless. It will never be an apples-to-apples comparison or even a comparison of types of apples (E.G. I still hold hope that SAP could get serious about supply chain planning, but I have given up on Oracle (with the exception of transportation management.))
The customizable dashboards and reports show the total estimated emissions from FourKites-tracked freight, and enable a deep dive into emissions by mode, changes over time, and comparison to industry benchmarks. This information can be used to make decisions on modes of transportation.
However, the key part of this comparison is the fact that Sanofi never drove improvement. While I believe that customer service and ESG should be included in the balanced scorecard, I cannot find a set of data across industries good enough to drive this comparison. An average margin of 21% with inventory turns of 1.58
Have you ever wondered if your transportation spend is as optimized as it could be? Join Hannah Testani, COO of Intelligent Audit, as she takes us through the reasons why your shipping could cost so much, and how to use big data and digital transformation to move the needle on your transportation spend. The real ROI of accessible data.
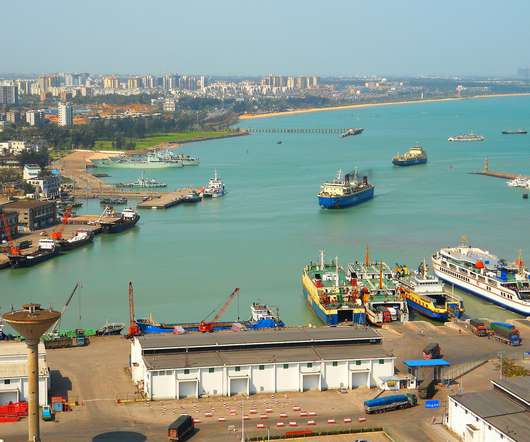
The international inbound transportation service is only available to Walmart Fulfillment Services (WFS) sellers that source or manufacture goods in China, and all cargo must be shipped from Yantian, Shanghai, or Ningbo ports. are then directly transported to a Walmart fulfillment center. according to the Walmart Marketplace website.
GlobalTranz’s main service lines are freight brokerage – less-than-truckload and truckload – and managed transportation services. Robinson’s last quarter earnings in North American Surface Transportation, up 10.8% – which many companies would be delighted with – seem paltry in comparison. That makes C.H.
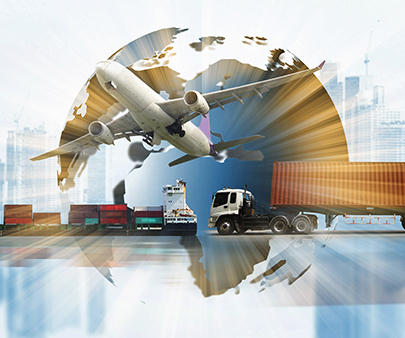
Avenues of transport are declining as major cargo airlines, like Cathay Pacific , drastically reduce flights to mainland China and Hong Kong. A recent online survey conducted b y MIT’s Center for Transportation & Logistics aimed to understand how companies are reacting to the Coronavirus outbreak.
Definitions: Oxymoron: The combination of contradictory or incongruous words (such as cruel kindness) Juxtaposition: The act of placing words or concepts close together or side by side, for comparison or contrast. The difference between an oxymoron and a juxtaposition lies in usage. The frequency of planning should match the business process.
Creating trucking efficiency through transportation management optimization is an essential part of supply chain management and network navigation. Easier comparison of rates, timeliness, availability, and services. within the transportation network. current LTL transportation ?rates Better optimization of?
As data in transportation becomes more abundant and readily available, the question of “ What data is available ?” If portions are supplied from other parties, it is vital to expose possible exceptions or differences in interpretations of the data provided in comparison to what you control. Business Advice Technology Transportation'
3) Mode of Transportation : since material flows from one point to another, you need to identify the mode of transportation that you''re currently using. 2) Current and Future Demand : once determining the location, you need to group the demand / supply points so you can determine the current and future demand.
If you’ve ever paid $10 for an Uber ride to the cocktail lounge in the evening and then a “surge priced” $50 for the same distance Uber ride back to your home only a few hours later around closing time, you understand the dynamics troubling shippers in today’s capacity constrained transportation market. Consider the potential savings.
While the performance rankings were based on comparisons of inventory turns, operating margin and Return on Invested Capital (ROIC) for the periods of 2006-2013 and 2009-2013, the concept is that to be a supply chain leader you must outperform and drive improvement. Can you help us with what you see in the data?” ” Yes, I said.
For this blog post, never mind the comparison. Align Transportation Planning and Distribution Requirements Planning (DRP). Transportation management focuses on price/lane/routing assignments, assuming logistics availability, while DRP translates product volume into deployment logic based on the translation of demand.
Under a transportation services agreement that kicked in last year, Amazon leases the aircraft from a dealer and transfers them to Hawaiian Airlines to fly and provide routine maintenance. billion to increase use of these vehicles to transport freight as part of an overall effort to improve air quality.
La Londe Best Paper Award, Journal of Business Logistics), Spillan, McGinnis, Kara & Yi (International Journal of Logistics Management), Winter & Knemeyer (International Journal of Physical Distribution & Logistics Management), Corsi, Grimm, Cantor & Wright (Transportation Journal), Nyaga, Lynch, Marshall & Ambrose (Harold E.
In addition to incorporating the impact of special events and promotions at the SKU/Location level, it is possible to do probabilistic planning with different service targets, supplier performance risks, and transportation alternatives that evolve with the changing business dynamics. This is also referred to as “composability.”
Companies that invest in AMR can reap significant savings, and for comparison purposes, Amazon saves approximately $22 million in each fulfillment center that uses Amazon Kiva Robots, says Jim Romeo of Robotics Business Review. The technology progressed within Amazon and in external technology development centers.
Comparison of Inventories Across the Years. Current processes single-thread tactical planning across functions and the data models for deliver (DRP), make (MPS), source (MRP or DDMRP), or transport (TMS) do not enable orchestration, or process interoperability. Today, as headline news reaches epic levels, we are at an impasse.
1-800-Flowers gave a presentation in which they talked about implementing Oracle warehouse management and transportation management systems in the Cloud. Oracle transportation management needed to be implemented quickly before the holiday season because their legacy TMS provider told them they would no longer support it. That is fast!
RPA can automate the uploading of reporting and contract data for transactions from contracts into Transportation Management Systems (TMS) or Enterprise Resource Planning (ERP) systems with greater speed and accuracy. Price Lookup and Comparison. Procurement. Another area where RPA is coming to the fore is in communication.
It’s clear that the oysters’ delivery route is more complicated than it may seem at first glance, particularly in comparison with our own holiday journey to the French Atlantic coast. Supply Chain Planning & Optimization Transport & Logistics' Leave a comment below or drop us a tweet @Quintiq.
This article is from Descartes and it discusses the pitfalls to avoid when choosing a Transportation Management System (TMS). Therefore, many businesses are looking for a stable and intuitive transportation management system (TMS) that optimizes the logistic process and supports in managing (un)foreseen challenges.
By comparison, 85 percent of orders are accomplished in one delivery for those at the 75th percentile. As a percentage of the total fuel consumed in transportation and warehousing, respondents report that currently only 7 percent comes from renewable sources (at the median).
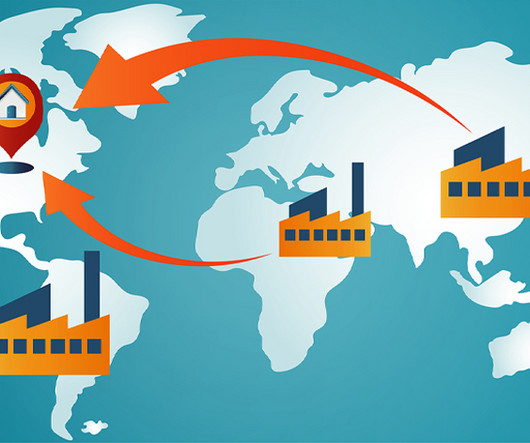
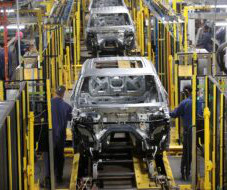
Industries such as semiconductors, electric vehicle (EV) batteries, and transportation equipment are at the forefront of reshoring efforts , leading to a fundamental shift in freight demand patterns. Aerospace and transportation equipment companies are investing in Arizona and New Mexico. Midwest U.S. Southwest U.S.
But in terms of transportation, the impacts won’t just be on fuel prices. FourKites , a provider of real-time transportation visibility solutions, has a big data set around transportation. While rising gas prices drive up the price of transportation, rising natural gas prices also affect global supply chains.
Table 2: Gartner Top 25 Comparison to Peer Group Results As large manufacturers work the conference circuit in the industry to increase brand awareness for their supply chain efforts, they feed the perception that their stories demonstrate supply chain leadership. Is this success? I don’t think so.
And when recent hurricanes, earthquakes and wildfires began wreaking havoc, many shippers were left asking themselves: “How have recent natural disasters affected our transportation network?” It has certainly been evident this year that natural disasters can significantly disrupt the supply chain. A Proactive Approach Using Actionable Data.
Consumers have embraced e-commerce for price comparisons, ease of purchase anytime and anywhere, and for those participating in subscription services such as Amazon Prime, free shipping, and other benefits. However, transportation and logistics costs can be prohibitive. are then directly transported to a Walmart fulfillment center.
We believe today’s transportation issues require a new design of TMS to manage them. With case studies, ROI comparisons and real-world examples, you’ll understand why a different type of TMS is needed to meet the modern-day needs of shippers, brokers and 3PLs. Download Making the Case for a Modern-Day Transportation Management System.
Comparison of Barcoding and RFID 1. The post Barcoding vs RFID: A Comprehensive Comparison, Advantages & Disadvantages appeared first on AB&R. Working: RFID systems consist of tags (or transponders) that contain electronically stored information and readers (or interrogators) that communicate with the tags via radio waves.
A simple comparison of big data can be seen by thinking about the factors that go into setting up a child's lemonade stand. . appeared first on Transportation Management Company | Cerasis. When Did Big Data in Supply Chain Become a Game-Changer? . Big data in supply chain is not a new concept.
Warehousing and Transportation Costs. The warehousing and transportation costs per item should also be tracked. The calculation is comparable to the previous calculations, dividing the total warehousing and transportation costs by number of shipped items over a given period of time.
Tushar Bhalla, the chief technology officer at CloudPaths, believes that COVID taught many companies that this higher-level constraint-based model also needs to include warehousing, transportation, and sourcing constraints. Mr. Bhalla spoke of one customer that has created roughcut plans in daily buckets.
Spiraling transportation costs, tariff shifts and increased expectations for customer service sparks new interest in supply chain planning. Outsourcing–procurement, manufacturing and transportation– decreased visibility and increased data latency. Supply Chain Risk Drivers: A Comparison of Risk. Why should you care?
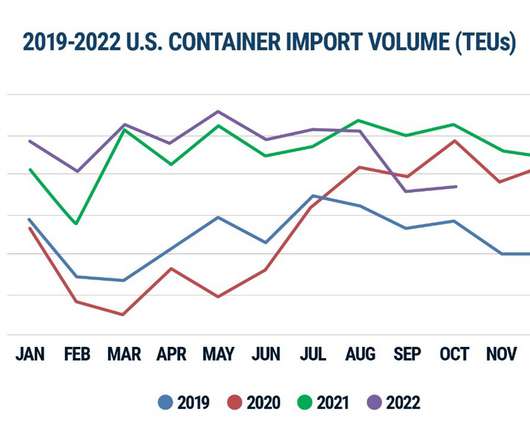
2023 call: Global supply chains will be slightly less busy, congested and chaotic, but cheaper – at least the transportation part. Container Import Volume Year-over-Year Comparison. Importantly, port delays remain an issue in 2022, especially for the East and Gulf Coast ports that had record years. Figure 1: U.S. Somewhat nailed it.
I read earlier this week that pressure on the supply of critical materials will continue to mount as road transport electrification expands to meet net-zero ambitions. For comparison, they spent $3.4 More companies looked to implement grocery deliveries, and third party companies looked to build out their rosters of drivers.
Such real-time data and visibility functions allow for supplier comparisons as well as overall emission source contributor identifications, which can be focused on for improvement. Crucially, the system will calculate the carbon emissions spewed out with every transportation move. It can be done via EDI, API or via a web portal.
An example is retail/consumer products/chemical/transportation or hospital/pharmaceutical companies/medical device companies/medical distributors.). We will then use this as a comparison table to understand the processes and technologies used by more mature companies. How does the methodology compare to the Gartner Top 25.
Clients can optimize transportation spend while managing logistics constraints, leveraging carrier network and insights AUSTIN, Texas – Oct. At Uber Freight, we’ve built one of the world’s largest managed transportation networks and support shippers with reduced overhead costs and flexible, scalable operations.
Expanded technology partnership enables shippers to optimize logistics and transportation spend in e2open’s Carrier Marketplace AUSTIN, Texas – Nov. E2open’s Carrier Highlight offers all TMS users access to the list of featured transportation providers, even if the carrier is not in the shipper’s network.
The question becomes, “how are you comparing your transportation metrics to what’s happening around you?” These network comparisons can also help analysts identify if a change is just part the natural ebb and flow of the supply chain, or points to a unique issue within their business.
Amazon’s because of their breath in physical and digital supply chain, innovation in material handling, transportation, etc and their vision completely disrupting the industry. They do not have a peer group for comparison. We do not include them in the analysis because there is no peer group comparison. About the Research.
We organize all of the trending information in your field so you don't have to. Join 102,000+ users and stay up to date on the latest articles your peers are reading.
You know about us, now we want to get to know you!
Let's personalize your content
Let's get even more personalized
We recognize your account from another site in our network, please click 'Send Email' below to continue with verifying your account and setting a password.


Let's personalize your content