This site uses cookies to improve your experience. To help us insure we adhere to various privacy regulations, please select your country/region of residence. If you do not select a country, we will assume you are from the United States. Select your Cookie Settings or view our Privacy Policy and Terms of Use.
Cookie Settings
Cookies and similar technologies are used on this website for proper function of the website, for tracking performance analytics and for marketing purposes. We and some of our third-party providers may use cookie data for various purposes. Please review the cookie settings below and choose your preference.
Used for the proper function of the website
Used for monitoring website traffic and interactions
Cookie Settings
Cookies and similar technologies are used on this website for proper function of the website, for tracking performance analytics and for marketing purposes. We and some of our third-party providers may use cookie data for various purposes. Please review the cookie settings below and choose your preference.
Strictly Necessary: Used for the proper function of the website
Performance/Analytics: Used for monitoring website traffic and interactions
Doug Estrada and Joe Lynch discuss Walmart transportation. Doug has held various supply chain roles with the Walmart Private Fleet as well as working Internationally for Walmart in Central America in setting up the Retail Transportation Supply Chain Network for Walmart in several Central American Countries. About Doug Estrada.
Managing transportation — the ebb and flow of rates, capacity, fuel and regulations — is an ongoing challenge for many companies, especially those still using spreadsheets and fax machines to plan and execute shipments. to deliver sustained business value.
It is better to receive inventory on a loading dock, take the inventory needed for a hot shot shipment, and move that inventory through the DC to a shipping dock where it is loaded on a truck. Flowthrough needs planning that spans across both warehouse and transportation management systems. This is known as ‘flow through.” It doesn’t.
We’ve discussed the basics of OTIF and the fundamentals of OTIF before, but we thought we’d drill down deeper into the individual metrics. First, we’ll start by reviewing the basic goals of OTIF, and then we’ll dive into each metric and the compliance issues of each metric. Late Transport Notification. Collect Ready (i.e.
If you get an invoice for your DC Outbound account number this week which contains roughly a week’s worth of shipments, you will receive an invoice for this same account next week with roughly a week’s worth of shipments. Use the Correct Metrics. Therefore, using the correct metrics is crucial. However, don’t stop there.
The second goal was to work with a fourth party logistics (4PL) partner that had invested in cutting-edge transportation management and visibility solutions. A 4PL is a company that plans and executes transportation on behalf of their customers. The company chose 4Flow to do transportation planning and execution in Europe.
The reason why they can do this is that customized products are sold directly to customers so they have the higher profit margin to compensate the higher transportation cost. Managing transportation at this scale is the absolute challenge. In order to compensate a long waiting time, Adidas uses air freight or courier service.
Looming transportation shortages in the United States with the adoption of AB5 and the redefinition of the owner-operator are risks. The focus needs to move from functional metrics to balanced scorecard outcomes. Functional metrics insulate organizations and throw the supply chain out of balance. Green stagnation? The answer?
The solar panels will reduce the building’s carbon footprint by approximately 4,100 metric tons of carbon dioxide per year. I highly recommend watching the movie when you get a chance. And now on to this week’s logistics news. China was ranked second at 12%, followed by Denmark (9%), Australia (7%) and South Korea (6%).
performance metrics to influence vendor behavior and impact sourcing choices. As performance reporting metrics capture vendor performance, the company can substantiate penalties for noncompliance and poor performance, recognize or reward high performers, and incent positive results and consistent behavior. Sourcing uses P.O.
The results of that effort — including a 3-5% reduction in Bayer’s overall transportation spend — was the focus of two breakouts at ICON 2024. Along with Ben Ames, Senior Editor at DC Velocity , I joined these experts for a recent webinar called “A Guide to Mastering Automation in Transportation, Warehouse, and the Yard.”
Transportation management system (TMS). A TMS is software that collects data and tracks the processes associated with moving goods, both inbound and outbound, and across all modes of transportation including rail, air, surface, and sea. Let’s start with the basics. Warehouse management system (WMS). WMS revenues will increase from $2.75
Environmental Protection Agency (EPA) and the Department of Transportation’s National Highway Traffic Safety Administration (NHTSA) jointly proposed standards for medium- and heavy-duty vehicles that would improve fuel efficiency and cut carbon emissions. billion barrels over the lifetime of the vehicles sold under the program.
Reverse Logistics Strategy 3: Make it Profitable It makes sense to run reverse logistics as a profit centre with corresponding KPI and metrics. Network analysis will be crucial for finding the best configuration of return centres, given factors like retail locations and transport facilities with backhaul possibilities.
While internet-based transport exchanges offer potential, their effectiveness is still debated due to uncertainties in carrier and shipper participation. Postponement: Strategies like Just-in-Time and postponement can reduce inventory and transportation costs. Their strategic decisions now influence overall business performance.
Using technology to improve last mile metrics is essential to driving last mile costs down, but how do shippers know if the technology is helping or hurting? Essentially, shippers need to track these 11 metrics. On-Time Deliveries Are King of Last Mile Metrics. Fuel Consumption Rates. Planned Versus Actual Mileage.
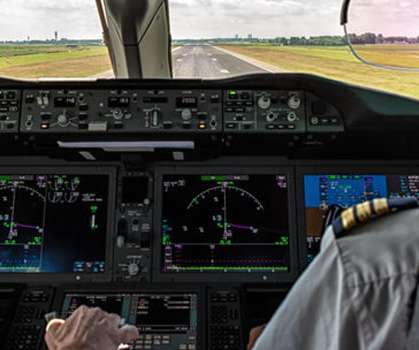
These key metrics become your organisation’s “multi-function display” and give you the primary data needed to monitor and manage “normal flight conditions.” ” Feel free to track lots more metrics in the background if you wish, but try to keep attention focused on the five or six “real KPIs.”
DC Velocity). transportation assets) to the equation. Consumer Convenience” will become a new supply chain metric (more on that idea in a future post). CSCMP 28th Annual State of Logistics Report: Accelerating into Uncertainty. Carrier warehousing, anyone? (DC I would also add Engines-and-Tires (i.e.,
Without a shared set of metrics between the commercial and operational teams, it is extremely difficult to get alignment between them. Examples of shared metrics include customer service levels, inventory turns, sell-through forecast accuracy, total landed cost, and overall profitability of the business.
TMS users in transportation logistics organizations are sitting atop a gold mine of actionable data captured by their TMS solutions. This data can be analyzed and leveraged to help reduce dwell times and improve DC throughput. Here are four ways smart TMS users can harness the power of their data for predictive analytics.
The ecommerce transition will continue to drive net job growth in DCs, even as companies invest in automation. As robots find their place in the DC, warehouse operators will face new challenges in coordinating and optimizing the work of humans and their robotic coworkers. Robots Are Not Killing DC Jobs.
General warehouse industry statistics Warehousing costs & revenue statistics Warehouse efficiency statistics Labor statistics in the warehousing industry Automation adoption in the warehousing industry Warehouse performance metrics Warehouse automation stats: General warehouse industry statistics 1. According to data from the U.S.
Until recently, the supply chains for CPG companies used to end with their distribution centers (DCs) serving Walmart DCs. The demand from a Walmart DC or another retailer’s DC was lumpy by definition. What OTIF means for you. Store demand in general was a theoretical concept, sometimes heard about and seldom utilized. .
Until recently, the supply chains for CPG companies used to end with their distribution centers (DCs) serving Walmart DCs. The demand from a Walmart DC or another retailer’s DC was lumpy by definition. What OTIF means for you. Store demand in general was a theoretical concept, sometimes heard about and seldom utilized. .
It currently just uses on-time metrics to grade suppliers and the store’s retail buyers can base purchasing decisions on a brand’s delivery performance. It is critical to leverage transportation analytics to get the most out of your operation. One large Sam’s Club distribution center (DC) is already using the new system.
The important element is to exhaustively identify metrics which need to be tracked by the testing teams and help in continuous learning process. There are also the web analytics teams; e-commerce agencies, etc. In short, numerous nodes and decision making teams need visibility to the same data, track synergistic measures and take decisions.
Accessibility: The ability of a freight carrier to provide transportation between the named points of origin and destination. ADR: A governing standard for transportation of dangerous/hazardous materials by road. Air Cargo: Freight that is transported by an aircraft. Flammable solids Class 4.2: Oxidizing substances Class 5.2:
As highlighted by Transport Topics in a January 2022 article discussing freight shipping analytics, “ Data shows total truckload rates year-over-year are holding around 12% higher. Increase DC or Warehouse Pickup and Delivery Efficiency. Enable Real-Time Transportation Tracking. They are forecast to grow 2.5%
They handle activities like warehousing, distribution, and transportation for other businesses. DC Distribution Centre – A warehouse facility that stores and distributes products to retailers, wholesalers, or directly to consumers. Essential for proper handling and transportation of certain goods.
Metrics and Auditing Prevent Overbilling and Overpayment to Vendors for Shipping Costs. Through modern technology, the inbound logistics strategy can be executed easier than believed, and real-time order tracking and metrics prevent overbilling and overpayment.
These orders generally arrive by the container and are transported directly from the manufacturer to the retailer’s distribution center. Brands don’t need to hold the inventory, may not need to arrange transportation and don’t need to forecast for that subset of products. The Challenges of Direct Import.
Whether your company is a big or small player in terms of shipping volumes, and regardless of your chosen transportation modes (road, rail, ocean, air), the health of your bottom line depends in no small part on the competitiveness of your ocean freight prices. There’s no dark art to freight benchmarking.
This involved procurement, maintenance, and transportation of military facilities, services, materials, and personnel. To help give easy access to anyone in the organization regardless of the location across several systems, like warehouse management, transportation management, etc. Logistics has, however, come a long way.
Customer demand is a dynamic metric, which means that you need to keep estimating it based on evolving market forces such as customer preferences, weather changes, and changing industry trends. With Dynamic Adjustment of Distribution per DC, there was granular visibility of all SKUs with a demand-value matrix.
Blue Yonder’s capabilities in warehouse management and transportation management, along with Luminate Control Tower, enable increased productivity via automation, process improvement and organizational restructuring. Reduced transportation costs, without compromising service. million by leveraging these two solutions.
In modern freight transportation services, GRI stands for General Rate Increase. On the other side of the coin is the well-known freight transport surcharge. In turn, wages must increase, and carriers are inevitably spending more money to complete transport. Those costs cannot simply be absorbed. Normalize data.
It makes sense to run reverse logistics as a profit centre with corresponding KPI and metrics. Network analysis will be crucial for finding the best configuration of return centres, given factors like retail locations and transport facilities with backhaul possibilities. Speed will be an important factor.
The important element is to exhaustively identify metrics which need to be tracked by the testing teams and help in continuous learning process. There are also the web analytics teams; e-commerce agencies, etc. In short, numerous nodes and decision making teams need visibility to the same data, track synergistic measures and take decisions.
It’s not unusual for example, for companies to measure their supply chain performance only on the basis of financial metrics like supply chain cost per order. Warehouse Management Even if you have a well laid-out warehouse, DC optimisation doesn’t stop there. Don’t fall into that trap.
Why do some rival firms that battle with each other downstream in retail outlets manage to work well together upstream in their transport and warehousing? For example, a manufacturer may start to package finished goods in a way that eases handling by a logistics service provider who can then offer better prices for stocking and transport.
Once completed, the facility will house 40 dual-port DC fast-charging stations, 40 electric vehicles and 40 electric refrigerated trailers. terawatt-hours of solar power would eliminate more than 112 million metric tons of carbon dioxide emissions annually, the report found. into an electric vehicle hub. Generating the full 185.6
Why do some rival firms that battle with each other downstream in retail outlets manage to work well together upstream in their transport and warehousing ? For example, a manufacturer may start to package finished goods in a way that eases handling by a logistics service provider who can then offer better prices for stocking and transport.
It’s not unusual for example, for companies to measure their supply chain performance only on the basis of financial metrics like supply chain cost per order. Even if you have a well laid-out warehouse, DC optimisation doesn’t stop there. Road Transport/Distribution. Don’t fall into that trap.
The answer lies using these omnichannel supply chain metrics to carefully track and improve operations continuously. This is a simple key performance indicator (KPI), another name for metrics, to track. If vendors fall behind on this metric, you may need to re-evaluate your partnerships or expand your list of approved vendors.
We organize all of the trending information in your field so you don't have to. Join 102,000+ users and stay up to date on the latest articles your peers are reading.
You know about us, now we want to get to know you!
Let's personalize your content
Let's get even more personalized
We recognize your account from another site in our network, please click 'Send Email' below to continue with verifying your account and setting a password.


Let's personalize your content