This site uses cookies to improve your experience. To help us insure we adhere to various privacy regulations, please select your country/region of residence. If you do not select a country, we will assume you are from the United States. Select your Cookie Settings or view our Privacy Policy and Terms of Use.
Cookie Settings
Cookies and similar technologies are used on this website for proper function of the website, for tracking performance analytics and for marketing purposes. We and some of our third-party providers may use cookie data for various purposes. Please review the cookie settings below and choose your preference.
Used for the proper function of the website
Used for monitoring website traffic and interactions
Cookie Settings
Cookies and similar technologies are used on this website for proper function of the website, for tracking performance analytics and for marketing purposes. We and some of our third-party providers may use cookie data for various purposes. Please review the cookie settings below and choose your preference.
Strictly Necessary: Used for the proper function of the website
Performance/Analytics: Used for monitoring website traffic and interactions
Last week I explained how individual tastes, compounded by geography, climate and less developed distribution and logistics infrastructure challenge beverage manufacturers in Asia. Imagine that you produce a popular Malaysian soft drink and you now want to break into the Philippine market. Let’s start with a scenario. The result?
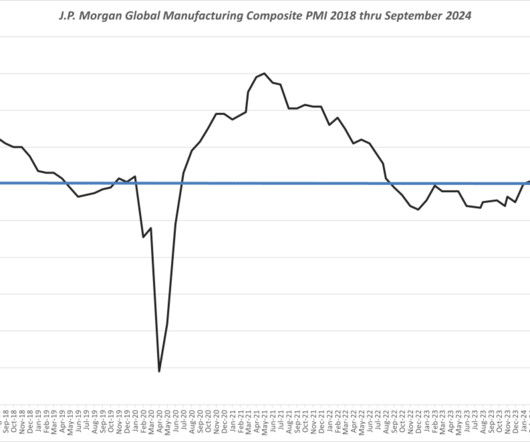
The reported September data provides added reinforcement of a global manufacturing slowdown occurring at the end of Q3-2024. Indices of new orders, production output and manufacturing employment have reportedly collectively declined while business optimism has reportedly fallen to a near two year low point.
Signs of Global Manufacturing Upturn Global-wide manufacturing levels as depicted in the J.P. Morgan Global Manufacturing PMI® reportedly improved in May with output and new orders in indices on the rise. Rates of manufacturing contraction eased across Europe and in Japan. The May reading of 50.9 The May reading of 50.9
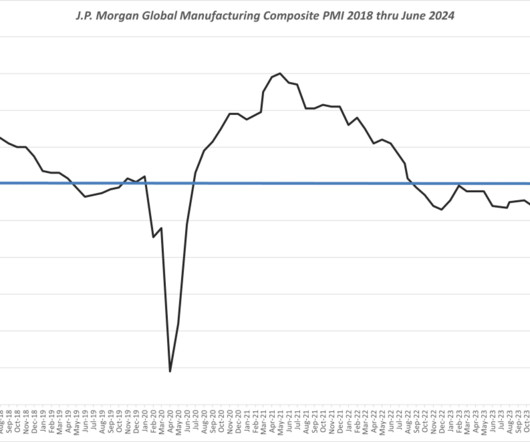
Global Manufacturing Output Global-wide manufacturing levels as depicted by the J.P. Morgan Global Manufacturing PMI® reportedly slightly declined in June with output and new orders indices on the rise. In the latter category, subdued market conditions were cited as an underlying factor in manufacturers’ business optimism.
However, even pre-COVID, the APAC region has faced a number of major interruptions to the supply chain, mostly driven by extreme weather events – typhoons in Japan, bushfires in Australia or mass flooding in the Philippines. Transport management systems are more important now than ever before.
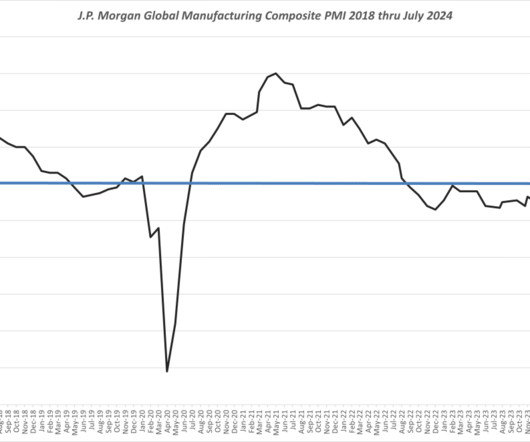
The latest data reinforces indications of a global manufacturing slowdown. Global Manufacturing Output Global-wide manufacturing levels as reported by the J.P. Global Manufacturing Output Global-wide manufacturing levels as reported by the J.P. Product demand levels are essentially focused on domestic market needs.
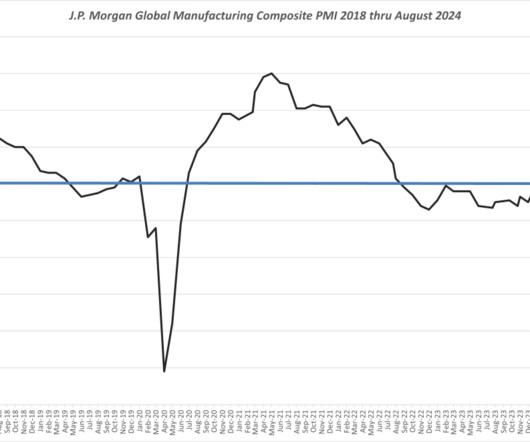
The August data further reinforces indications of a global manufacturing slowdown. Global Manufacturing Output Levels Global-wide manufacturing levels as reported by the J.P. Global Manufacturing Output Levels Global-wide manufacturing levels as reported by the J.P. This composite index produced by J.P.
A number of express packages, the medium most frequently associated with online purchases, is expected to skyrocket. One of the strategies manufacturers and online stores will take is to price their products uniformly across the participating economies. It all depends on the price differences, delivery time, and cost of shipping.
E-commerce opportunities and its expansion in the Philippines. As an e-commerce businessman, you can expand your business in countries like the Philippines or start your business in the Philippines to generate profit out of it. E-commerce and Logistics Challenges in the Philippines. Infrastructure and its defects.
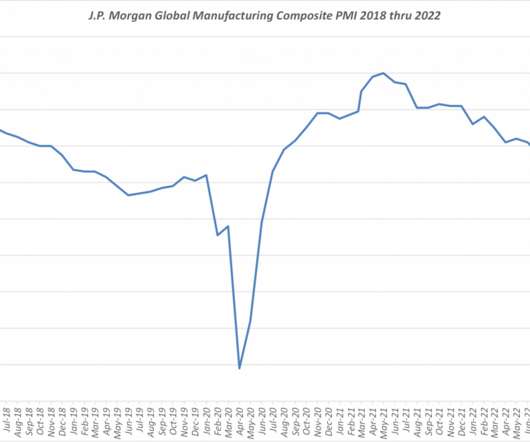
Global Manufacturing Activity Levels. Global manufacturing activity as reported by the J.P. Morgan Manufacturing PMI® which began 2022 at an expansion value of 54.2, Morgan Manufacturing PMI® which began 2022 at an expansion value of 54.2, Sources; S&P Global and ISM, 2022. has fallen 5.6 has fallen 5.6
Global Production Activity Rise Global-wide manufacturing levels as depicted in the J.P. Morgan Global Manufacturing PMI® began 2024 with output levels rising for the first time in eight months. Global manufacturing employment levels fell for the fifth straight month. Manufacturing , there were mixed consensus.
The alternative supply chain or “ Altasian” is defined as countries consisting of Japan, South Korea, Taiwan, India, the Philippines , Indonesia, Singapore, Malaysia, Thailand, Vietnam, Cambodia and Bangladesh. billion in population will be the linchpin of an alternative sourced Asian supply network. One example indicated was that U.S.
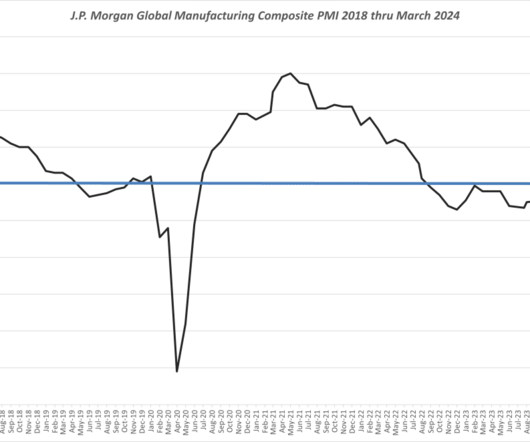
Global Manufacturing Output Levels Strengthen Global-wide manufacturing levels as depicted in the J.P. Morgan Global Manufacturing PMI® ended March on an optimistic footing. Of further significance was the March report indication that the rate of growth in global manufacturing output has accelerated to a 21-month high.
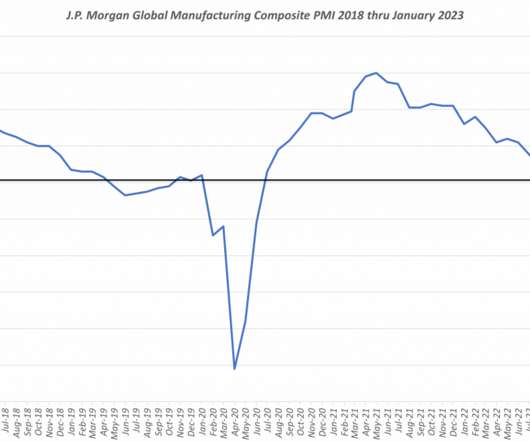
Global Manufacturing Activity Levels Global manufacturing activity as reported by the J.P. Morgan Manufacturing PMI® , compiled by S&P Global in association with ISM and IFPSM , halted a consecutive five-months of contraction levels to that of no-change. The S&P Global US Manufacturing PMI® had a February value of 47.3,
The implementation of digital technology unfolds in three main areas; warehouse management, manufacturing processes and distribution chain management. Current State of International Transportation Industry – LogiSYM October/November 2020. It is a collaborative endeavor that requires strategic repositioning of the company.
Supply Chain Matters provides our monthly highlights commentary and perspectives on published monthly global manufacturing PMI and supply chain activity indices. Now, with September and full Q3 reporting available, global manufacturing activity has officially fallen below the 50.0 Global Wide Production Activity. represented a 0.5
There are however many other companies that do not trade tangible goods across borders but may be able to benefit from provisions on services, investment and government procurement etc. Decisions are taken within organisations, for example, by a procurement team, that affect ongoing compliance with FTA rules. MORE FROM THIS EDITION.
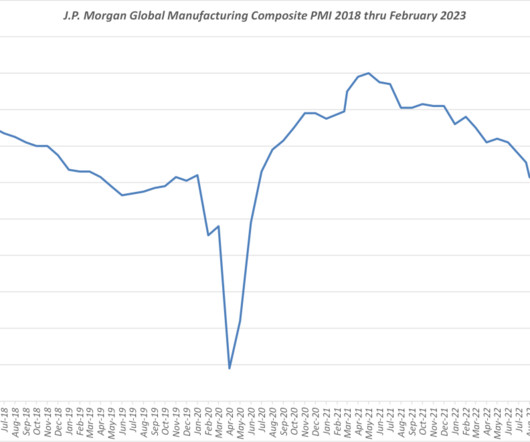
Supply Chain Matters provides monthly highlight commentary and perspectives on published January 2023 global manufacturing PMI and supply chain activity indices. Our previous posting in this series of global wide manufacturing PMI highlights was in early January summarizing both December and Q4-2022 reported indices data. increased 0.4
Slight Rise in Global Wide Production Activity Global-wide manufacturing levels as depicted in the J.P. Morgan Global Manufacturing PMI® was headlined with back-to-back expansion levels in February. The HSBC India Manufacturing PMI® rose from 56.5 Manufacturing Among the two reported PMI reports relative to U.S.
However, despite becoming the latest epicenter for sourcing and manufacturing activities, economic growth in certain countries is expected to slow down this year due to various reasons. This is a direct result of the overstocking/stockpiling that happened in Asian manufacturing and retailing sectors. Political Impacts.
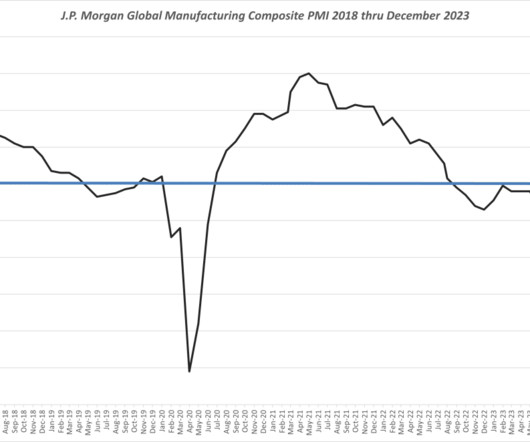
Global Production Continues to Contract Global-wide manufacturing levels as depicted in the J.P. Morgan Global Manufacturing PMI® ended 2023 on a noted lackluster footing. Manufacturing production reportedly contracted at a slightly quicker pace in December, dashing hopes for a point of stabilization. The December reading of 49.0
That’s good news for agriculture and manufacturing in the state, two industries that rely heavily on almost nonexistent water. A shorter monsoon season in Indonesia, the Philippines, and Malaysia will help miners procure more materials, used heavily in the electronics industry. The Southern U.S.
Most analysts believe the future looks bright for renewable energy sources. This means that ever-more of our energy system can become less reliant on traditional sources such as coal, oil, and natural gas, thereby reducing greenhouse gases in the atmosphere.”[3] ”[4].
Supply chain risk needs to be viewed holistically as it impacts on all areas of business from manufacturing, warehousing, distribution, and sales. Because many businesses operate under single-sourcing strategies they were unprepared for the shutdown of primary suppliers. The Pros and Cons: International and Domestic Sourcing.
A further noteworthy trend pointed out was increased labor unrest occurring in countries like France , the Philippines, South Korea and Indonesia. A further global transportation disruption consideration for the second half are reports that U.S. Perhaps that is in the detail.
Update 8/7/2015, 04:00 PST: Typhoon Soudelor Disrupts Air, Rail Services in Taiwan Air and land transportation services in Taiwan have been halted since Friday, August 7, as Typhoon Soudelor moves closer to the region. Learn what you should expect, and how to best prepare your company’s supply chain.
Philippines. Sourcing from far-flung countries such as China is leading to growing uncertainty about the actual supply of purchase orders. Norfolk Island. Northern Mariana Islands. Palestinian Territory, Occupied. Papua New Guinea. Puerto Rico. Russian Federation. Saint Helena. Saint Kitts and Nevis. Saint Lucia.
Given that China represents the lions share of Asian sourcing, it is worthwhile to take some time to focus on its risks. While supply chain risks in China are not typically as pronounced as that of other Asian sourcing countries, the high volume sourced from China raises the total risk. And as they wait to hear about possible.
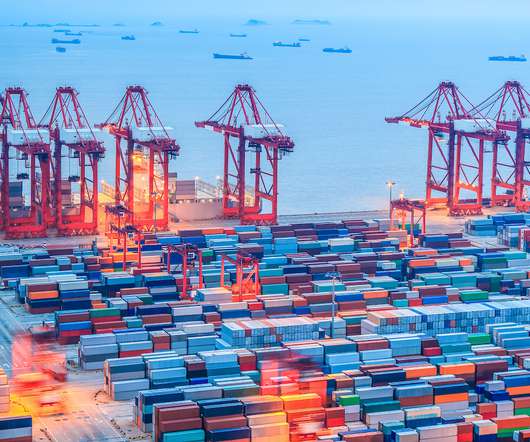
With as much as 90 percent of international trade being transported across ocean waterways, there are important findings for multi-industry supply chain and logistics management teams included in this report. Globally, the largest risk areas are defined as being South China, Indochina, Indonesia and the Philippines.
It even took authorities some time to recognise the vital importance of warehouse logistics, supply chain continuity, truck drivers and other transport operators. Arising from the pandemic is risk diversification i.e. reducing sourcing risks from China. Chairman — Chartered Institute of Logistics & Transportation (CILT).
This change in perception, coupled with rapid urbanization, means more Asian consumers are using the web for food purchasing and are comfortable buying frozen foods online. In the Philippines, there is another ongoing shift in food purchasing habits.
Following the earthquake, tsunami warnings were sent out in Taiwan, Japan, and The Philippines, but have since been lifted. Taiwan is the global leader in semiconductor manufacturing, producing over 60% of the world’s semiconductors and over 90% of the most advanced chips. Multiple wharfs at the port suffered bulging.
The same can be true for evaluating different transportation options. Severe weather can cause substantial delays, or even total shutdowns, of certain routes or modes of transportation. The number of heat stress days may rise to as high as 364 in Singapore and Malaysia, with Indonesia looking at 355 days and the Philippines 337.
Purchasing and supplier management. Production/manufacturing. Transportation. Later in this article we’ll look at some examples of functional and cross functional KPIs. Broadly speaking though, the following areas are those where KPIs will be necessary: Order capture. Inventory management. Warehousing.
The latest data regarding October reinforces that global and regional manufacturing levels remain subdued, similar to this condition during all of the Q3 period. Global Manufacturing Output Levels Global-wide manufacturing levels as reported by the composite index produced by J.P. up from the adjusted value of 48.7
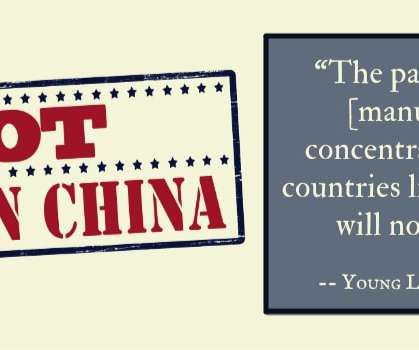
Whether to relocate supply or manufacturing from China to another low-cost country or switch to a near-shoring or re-shoring strategy is not a decision to take lightly. Nike: The world-famous sportswear brand has been moving manufacturing from China to some African and Southeast Asian countries.
RELATED CONTENT RELATED VIDEOS Global Gateways Ocean Transportation Supply Chain Security & Risk Mgmt Supply Chains in Crisis Related Articles U.S. Truce Ocean Transportation Container Ship Explodes, Catches Fire Off Coast of India Global Gateways J.B. Navy Issues Rare Warning to Ships Near Vital Hormuz Strait U.K.
Commandment 9: Insist on User Friendliness Independent of the effort put forth to design a system, purchase hardware and develop software, the single biggest test of implementation occurs when an operator attempts to scan bar coded media. lost net about 200,000 manufacturing jobs per year to offshoring. We have to keep this in mind.
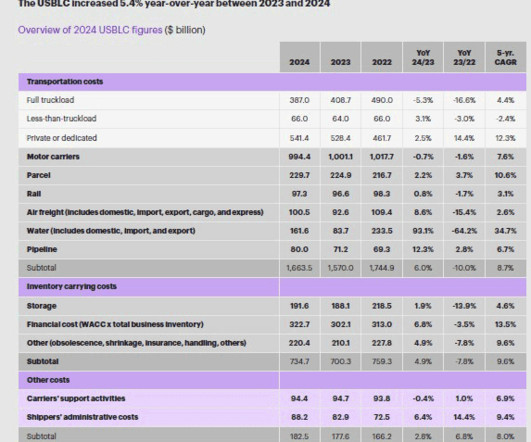
The US thus spent about $131 billion more in parcel shipping than it did in rail transport last year - a bit more than a delta of $127.4 of total transport costs and 38.5% of total transport costs and 8.9% of transportation spend – down from 6.1% With overall transport costs rising 8.7% Gilmore Says.
Jo Ann Tudtud-Navalta Materials Management Manager, Chong Hua Hospital, Cebu City, Philippines Posted on: Aug, 21 2016 I agree totally with Mr. Schneider. lost net about 200,000 manufacturing jobs per year to offshoring. In order to help companies decide objectively to reshore manufacturing back to the U.S.
Jo Ann Tudtud-Navalta Materials Management Manager, Chong Hua Hospital, Cebu City, Philippines Posted on: Aug, 21 2016 I agree totally with Mr. Schneider. lost net about 200,000 manufacturing jobs per year to offshoring. In order to help companies decide objectively to reshore manufacturing back to the U.S.
The trade war is likely to extend the for-hire freight recession further as higher prices reduce goods affordability and consumers’ real incomes.” ( See More Below) CATEGORY SPONSOR: SOFTEON Each month, Cass nicely summarizes the state of freight, as seen in the graphic below for May: Source: Cass An y reaction to thi s Cass report?
That also led Klappich to recently define a new category of software, which Gartner calls a Multiagent Orchestration Platform (MAOP) for managing mobile robots in warehousing and manufacturing. ( lost net about 200,000 manufacturing jobs per year to offshoring. Why IoT generically is not on the curve this year I wondered myself.
We organize all of the trending information in your field so you don't have to. Join 102,000+ users and stay up to date on the latest articles your peers are reading.
You know about us, now we want to get to know you!
Let's personalize your content
Let's get even more personalized
We recognize your account from another site in our network, please click 'Send Email' below to continue with verifying your account and setting a password.


Let's personalize your content