This site uses cookies to improve your experience. To help us insure we adhere to various privacy regulations, please select your country/region of residence. If you do not select a country, we will assume you are from the United States. Select your Cookie Settings or view our Privacy Policy and Terms of Use.
Cookie Settings
Cookies and similar technologies are used on this website for proper function of the website, for tracking performance analytics and for marketing purposes. We and some of our third-party providers may use cookie data for various purposes. Please review the cookie settings below and choose your preference.
Used for the proper function of the website
Used for monitoring website traffic and interactions
Cookie Settings
Cookies and similar technologies are used on this website for proper function of the website, for tracking performance analytics and for marketing purposes. We and some of our third-party providers may use cookie data for various purposes. Please review the cookie settings below and choose your preference.
Strictly Necessary: Used for the proper function of the website
Performance/Analytics: Used for monitoring website traffic and interactions
At each company, there is a relationship between the metrics of growth, margin, inventory, customer service, and asset strategy. For the purpose of this article, I will use Return on Invested Capital (ROIC) as the proxy metric to discuss asset utilization.) Supply chain excellence was largely defined as manufacturing excellence.
In March 2023, the Global Supply Chain Pressure Index fell to the lowest level since November 2008. For organizations layered in functional metrics and driving a cost agenda, this is a tough nut to crack. The average brand owner outsources 28-35% of manufacturing, but most coordinate using only spreadsheets and email.
As a result, the metrics have to be viewed together as a pattern over time. In the journey, the supply chain leader needs to improve the potential of a portfolio of metrics. The metrics of growth, Return on Invested Capital, Inventory Turns and Operating Margin have the highest correlation to market capitalization.
by John Westerveld Over the years, working for and with numerous manufacturing companies, I’ve seen many supply chain practices that cost companies money. Reason #9 Relentless pursuit of one supply chain metric at the expense of other metrics. Reason #7 Making decisions based on bad data (supply chain data accuracy).
Resilience Project, its methods has been tested under many extreme circumstances such as, - 2008: Chengdu Earthquake in China. However, the logic Cisco uses to manage the disruption is very robust and details are summarized into the infographic below, Note: metrics data is for illustrative purpose. And according to the U.S. Discussion.
The average manufacturing company’s supply chain organization is 15 years old. The supply chain is a complex system with finite, and non-linear relationships between supply chain metrics that drive balance sheet results. We find that companies can improve one, but not two of the metrics. A Look at History. Resiliency.
For the past five years, the team at Supply Chain Insights identified Supply Chains to Admire Award Winners by analyzing performance by peer group on the key metrics of growth, operating margin, inventory turns and Return on Invested Capital (ROIC). At Rockwell this includes all processes end-to-end except for manufacturing.
Sales and Operations Maturity Model from 2005-2008. Notice how the water turns from blue to brown in Figure 3 with the lack of demand translation capabilities within the enterprise for manufacturing and logistics. Organizations can align to drive value despite the allegiance to functional metrics. Let me explain. Mistake #5.
For the past five years, the team at Supply Chain Insights identified Supply Chains to Admire Award Winners by analyzing performance by peer group on the key metrics of growth, operating margin, inventory turns and Return on Invested Capital (ROIC). At Rockwell this includes all processes end-to-end except for manufacturing.
Doing its part, IBM has just released its corporate responsibility report for 2008 and it dedicates a big part of it to its supply chain. By the end of 2008, we had completed a cumulative total of 553 initial audits; including expansion into three additional growth market countries (36 initial audits): Argentina, Malaysia and Vietnam.
49% of respondents were from the manufacturing industry, 16% from the mechanical engineering sector, and 11% from the automotive market. As some component lead times push into 2023, the shortage is expected to last 24 months before it recedes – similar to the chip shortage of 2008-2009. Consultancy UK). Source: Consultancy.UK.
Over the last decade, neither the pharmaceutical nor medical device manufacturer has been able to drive the revenue/employee productivity gains of their comparative peer groups. Figure 2 contrasts the state of cash-to-cash cycles between 2000-2003 and 2008-2011. Power is shifting to the hospital. I think both factors are at play.
SanDisk Corporation designs, develops and manufactures flash memory storage devices and software. The company is the third-largest manufacturer of flash memory in the world. The journey began with a one size fits all approach in 2008, and the policies evolved over the course of the last seven years.
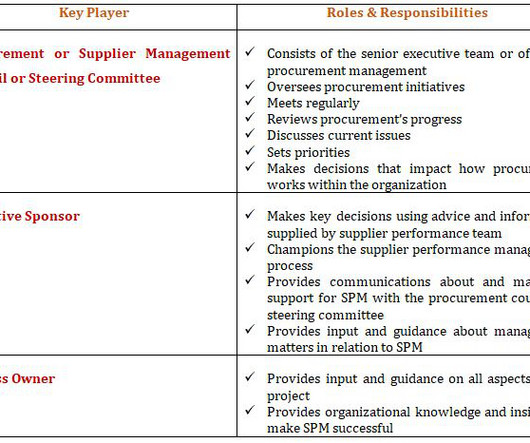
Current State of Supplier Performance Management Nowadays, the interest in improving supplier performance management methods has increased due to the increase in global sourcing and that of the global economy in particular (Gordon Sherry R, 2008). The questions that are most often asked are: What metrics should I use?
Public awareness and mass retailer initiatives have driven major sustainability efforts over the last two decades among CPG manufacturers. Driven by aggressive targets and retailers’ “supplier scorecards”, their progress has been enabled by advances in materials engineering and manufacturing technology. . Among the challenges: .
based electronics manufacturer. It’s a Sunday morning in May 2008. There has been a major earthquake in Chengdu, China… where several of your key items are manufactured. What customer orders are impacted, what revenue is impacted, how does this impact your manufacturing plans. This is bad…. This is bad…. Act Faster.
While the rest of the world was deep in a recession in 2008, and manufacturers were struggling with payroll decisions and layoffs, Hadoop innovation was in full swing. In the recession of 2008, it took the average consumer products company three-to-five months to sense the recession and redefine product plans. Streaming Data.
Public awareness and mass retailer initiatives have driven major sustainability efforts over the last two decades among CPG manufacturers. Driven by aggressive targets and retailers’ “supplier scorecards,” their progress has been enabled by advances in materials engineering and manufacturing technology. Among the challenges: .
Overall Results on the Supply Chain Metrics That Matter. In the period of 2008-2009, both supply chains made some major shifts. With a strong manufacturing culture, much of the focus was on lean production systems. Supply chain leaders make progress in three-to-five years. It is seldom a step change. How Have They Done?
However, in 2008 when the business grew +20%, inventories declined substantially, and part of his team won a Syngenta internal award, it became clear. In 2008 the market was ballistic. They will be featured in our digital showcase and are a part of the Jabil story on digital manufacturing. The times were tough.
In a highly inspiring key note presentation at the supply chain conference, Fareed Zakaria of CNN spoke about how the jobs recovery following the 2008 recession lagged the economic recovery by as much as 64 months while the same metric for the previous recessions was significantly narrower.
Therefore, the challenge to establish the ranking method is to find a more economical data source and the unbiased metrics. Anyway, the access to this database costs an arm and a leg. Ranking of Supply Chain Books We're sure some of you've been using Google Scholar to find related publications. The links below are #paid links. & Tang, C.
General warehouse industry statistics Warehousing costs & revenue statistics Warehouse efficiency statistics Labor statistics in the warehousing industry Automation adoption in the warehousing industry Warehouse performance metrics Warehouse automation stats: General warehouse industry statistics 1. in Q1 2017, the lowest since 2008.”
He discussed the adoption of the steam engine and the electric motor in the manufacturing sector. Today, we take these technologies for granted, but the electric motor was the genesis of the horizontal manufacturing plant. In 2008, I was asked to visit DuPont to talk about demand sensing. This was the case for DuPont in 2008.
But to make their strongest case, SCRM advocates need to focus on one key metric: return on investment. Collaborate with stakeholders in finance, sales, manufacturing, etc., The unprecedented supply chain disruptions caused by COVID-19 provide potent arguments for supply chain pros seeking greater support of SCRM from C-level leaders.
In the fall of 2008 I attended a major consumer packaged goods company’s global customer team meeting. A contract manufacturer shares discount pricing based on forecast accuracy of the customer. Reflections. My insights on the topic are now a decade old. The topic was “Customer First.” Forecast Accuracy.
The cost of recovery from a disruption in procurement management depends on factors such as supply source, volume, manufacturing location and inventory. Managers must tie their efforts to mitigate risk with metrics that will result in the long-term support of higher management. Poor Framework for Accountability.
the “inventory to sales” ratio (inventory levels divided by a month’s worth of sales) spiked in late 2008/early 2009 as the recession caught companies with way more inventory than needed versus suddenly shrinking demand. “In the US economy, overall inventory levels have been ticking up in recent years. Read Full Article.
The type of contract of interest in this report is for Development and Manufacture contracts in the Aerospace and Defense industries. The subcontract efforts feature the majority of military and part of commercial aviation, systems are outsourced by the overall airframe manufacturer, known as “primes” (Boeing, Airbus, Sikorski, etc.)
Industrial Manufacturing. In this blog I will focus on first couple of sub process of demand planning cycle - 1) Setting up demand planning objectives and metrics for different business units/customers/key items/locations 2) Setting up the frequency of the forecasting process (create/review/publish) with the time horizons. Automotive.
The production and use of biobased products replacing petroleum-based products has the potential to reduce GHG emissions up to 10 million metric tons of CO2 equivalents. Vilsack, a former governor of Iowa, briefly ran in the 2008 presidential race and was considered by Hillary Clinton as a potential running mate in 2016.
We may want to review their manufacturing facilities and perform some sort of quick assessment (for example, explore their process capability and yield of the product and how they handle returned parts). Include elements of the processes, technologies, organizational needs, control philosophy and metrics to analyze along the way.
Industrial Manufacturing. Insuring that each function, including online marketing, store operations and supply chain have common objectives, metrics and aligned rewards for the coming year. December 2008. November 2008. October 2008. September 2008. Automotive. Communication Services. Financial Services.
At Cerasis, our customers are manufacturers from the American Manufacturing Industry. A big part of that is because it is proven that the more labor productive and the more output the American Manufacturing industry produces, there is a large multiplier effect on the rest of the economy for creating jobs and economic sustainability.
Industrial Manufacturing. Example: For a shipper, number of shipments at a 3PL warehouse might be a relevant metric while the 3PL provider may be more interested in the number of shipments for all serviced shippers. December 2008. November 2008. October 2008. September 2008. Automotive. Financial Services.
Stuart William was in one of my former MBA classes at NC State in 2008, and graduated into one of the worst economies ever in May of 2009. The are a regional make to order kitchen cabinet manufacturer, and have two primary sales channels of modular kitchen and bathroom cabinets. They have 5 MFC retail outlets, and a dealer network.
Industrial Manufacturing. Consistent Business Intelligence - BI metrics can be obtained consistently across the entire business banking on the foundation of single version of master data. December 2008. November 2008. October 2008. September 2008. Automotive. Communication Services. Consumer Packaged Goods.
Industrial Manufacturing. IT enablement in areas like Mobile work management, Health and Safety, Metrics monitoring (KPI) etc. December 2008. November 2008. October 2008. September 2008. Automotive. Communication Services. Consumer Packaged Goods. Financial Services. Healthcare. Hospitality and Leisure.
Industrial Manufacturing. In this step, the actuals are compared with the planned metrics (MAPE, forecast accuracy, bias etc.) December 2008. November 2008. October 2008. September 2008. Automotive. Communication Services. Consumer Packaged Goods. Financial Services. Healthcare. Hospitality and Leisure.
Industrial Manufacturing. Some of those are Cognos, iLog, SPSS, Core Metrics, Emptoris, Vivisimo and many others, as world is moving from reactive to proactive. December 2008. November 2008. October 2008. September 2008. Automotive. Communication Services. Consumer Packaged Goods. Financial Services.
Industrial Manufacturing. As our main focus was towards asset intensive organizations, we looked more into Oil & Gas, Utilities and Manufacturing and Transportation industries. A further benefit of integration of these many systems is to allow organizations to effectively report on their sustainability metrics. October 2008.
Why This Matter for US Exporters and Manufacturers. One popular metric – a country’s logistics costs as a percentage of GDP – has China at 18% and the US at only 8.5%. With exporting prices so low for US manufacturers, all they need is the market…. Last week, Alibaba pulled in $17.4
While there was always passionate discussions on companies and metrics, the end goal was to raise awareness of supply chain as a practice. However, they seem to fall under the conglomerate issue, where multiple business units may skew the summary metrics. They’ve ranked #1 in the AMR/Gartner list for 7 straight years, since 2008.
The product evolved into a mission-driven company focused on sustainable and ethical manufacturing and a stylish, vintage-glam brand that makes sustainable choices easy and fun for consumers. To save even more time, Chip saves pre-filtered reports so he can come back to the same retailer or product-specific metrics whenever he needs them.
We organize all of the trending information in your field so you don't have to. Join 102,000+ users and stay up to date on the latest articles your peers are reading.
You know about us, now we want to get to know you!
Let's personalize your content
Let's get even more personalized
We recognize your account from another site in our network, please click 'Send Email' below to continue with verifying your account and setting a password.


Let's personalize your content